
Analyze how your funnels are performing period-over-period
Available for all Scholarship, Growth, and Enterprise customers
If seasonality affects how users engage with your product, you’ll probably find it useful to use time period comparisons to see the impact of your product changes. In Amplitude’s time series and bar chart visualization, you can see your KPIs during a certain time interval compared to the same interval in the previous week, month, quarter, or year. Now, we bring that same functionality to our funnel charts, conversion metrics, and conversion-over-time. This is especially useful if you want to validate whether new feature or improvement is affecting conversion now compared to a previous time frame.
Advanced funnel manipulation: hold one property constant and group by another property
Available for all customers
Visualize funnels in a way that makes sense for you and your product. Now you can compute your funnel holding one property constant while also grouping by a different user property. Now you can compare variations of your funnel in one view, instead of creating duplicate charts and comparing them side by side.
For example, if you’re an e-commerce business, you can measure cart conversion funnels by holding Session ID constant, and then group the final step of the funnel, ‘complete purchase,’ by the event property ‘Department’ to see where most of the purchases were made. By holding Session ID constant, a user is counted as converted every time they complete the funnel in a single session.
For more information on holding properties constant, check out this . And for more information on group-bys, check out this .
Measure your retention and usage interval on an hourly basis
Hourly retention available for all customers
Hourly usage interval available for all Scholarship, Growth, and Enterprise customers
If you have a high-touch product, like a mobile game, you might expect your users to interact with your product multiple times a day. Now you can view your user retention on an hourly basis up to 72 hours and your product’s up to 120 hours.
Customize your property distribution histogram
Available for all customers
Amplitude’s event segmentation chart lets you compute a number of different metrics. Among these, the histogram shows you the distribution of event totals by the selected event or user property (if it’s an integer). For example, if you have a music streaming app, you can view a property histogram showing the number of ‘Purchase Song’ events distributed by user age.
Previously, this histogram could only be rendered in one view, with a set granularity — but this might not always make sense for your analysis. Now, you can now customize your property histogram by specifying the minimum value, maximum value, and interval size. For example, I can view my distribution from a minimum of 10 to a maximum of 70, in intervals of 5. For more notes on the metrics module of event segmentation, check out our .
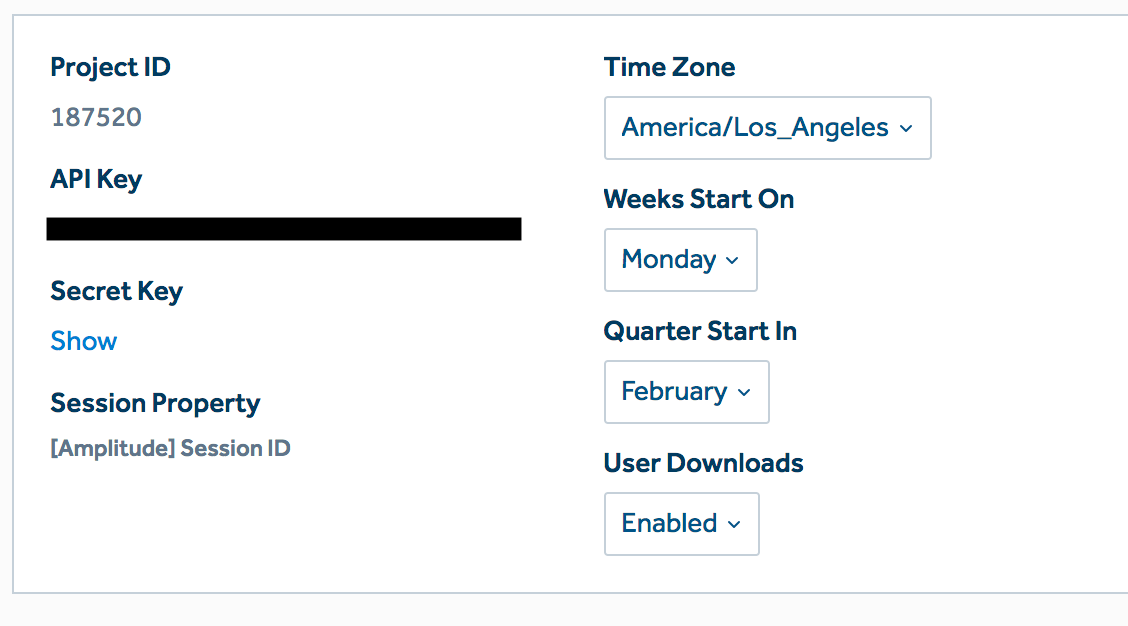
Control who has the ability to download users at the project level
Available for all customers
Restrict who gets to download users from Microscope or cohorts. If you wish to limit who in your organization can download users and view user attributes, you can configure this ability on a per-project level.
Set a default project for users accessing Amplitude through just-in-time provisioning
Available for all Scholarship, Growth, and Enterprise customers
Just-in-time user provisioning lets new users use single-sign on to access an Amplitude organization at a predefined permission level. Now, customers can use project permissions to set which project just-in-time users have access to when they first log into Amplitude.
Publicly share your Notebooks for better collaboration
Available for all Scholarship, Growth, and Enterprise customers
You might need to share the results of an experiment or relay the story behind an interesting behavioral insight with folks who aren’t active users of Amplitude someday. Never fear — now, your can create a shared link for your Notebook to better engage with your stakeholders. (P.S., If you want to learn more about , check out our deep dive here!)
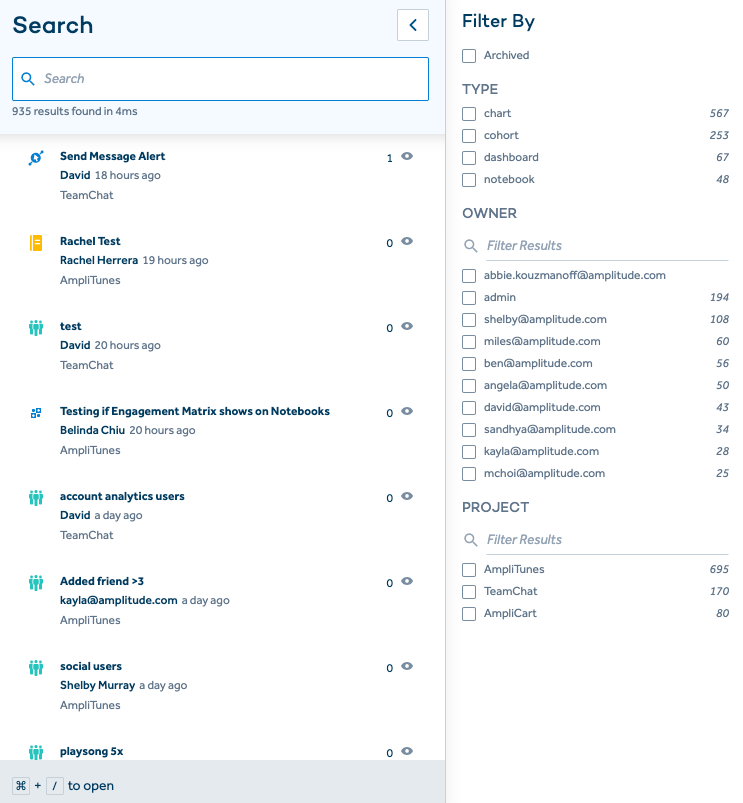
Search for content faster than ever with more filters
Available for all customers
We’re always trying to improve the search experience within Amplitude. Here are two new improvements that we hope will help you find content in Amplitude faster than ever.
- Find your own name pinned to the ‘Owner’ section of the Search tab so you can quickly filter by content that you’ve created.
- Filter your results by project — this is especially useful if your organization has many different projects in Amplitude.