Under the Hood: Measuring Session Replay's Real-World Performance Impact
From memory usage to network latency, our comprehensive testing shows Session Replay's impact is negligible—all while delivering powerful user insights.
Performance impact: Separating marketing from reality
Although companies love to boast that their latest software offerings have zero performance impact on their customer’s systems, all SDKs need to use some resources to function. When adopting a new SDK, we think about how much of a performance impact it will have and if it can affect the customer’s overall experience. What we have found with Amplitude Session Replay is that although the impact is not zero, it is a trivial amount that does not impact the user’s overall experience.
At Amplitude, we love to incorporate all of the products that we build into our own development lifecycle process. This is no different for us when it comes to Session Replay, as we use it across our own applications. Session replay is a powerful tool that provides qualitative insight into our many Amplitude users. Our bar for using performant applications is exceptionally high at Amplitude, so without question, we want our own customers to experience our application in the most performant and smoothest way possible. Since we run the Session Replay plugin across our Amplitude applications, we decided to perform an analysis ourselves to determine the impact Session Replay has on our complex web applications.
At first glance, it may seem like Session Replay records the user’s current session, saves it somewhere, and replays it in the player. But in fact, Session Replay is actually reconstructing the user experience based on movements, clicks, and keystrokes, as a user interacts with a website or app. It does this by leveraging the MutationObserver API to capture changes in the Document Object Model (DOM)—essentially changes in an application’s HTML. From there, we can reconstruct the user’s session through the deltas.
Now, you might think that capturing the DOM can be extremely slow and large. However, we only need to capture one snapshot of the DOM, either on initialization, page change, or focus. Then, we can simply capture important events as they occur in the DOM, such as interactions or styling changes.
Assessing the impact of Session Replay on browser performance
When measuring browser performance, a few key values are always in question, including memory and network bandwidth, since these are fairly straightforward to analyze with the Chrome DevTools. First, we ran the memory profiler assessment provided by Chrome, which analyzes the heap over time—how much memory the page uses over time as interactions are made on the web page.

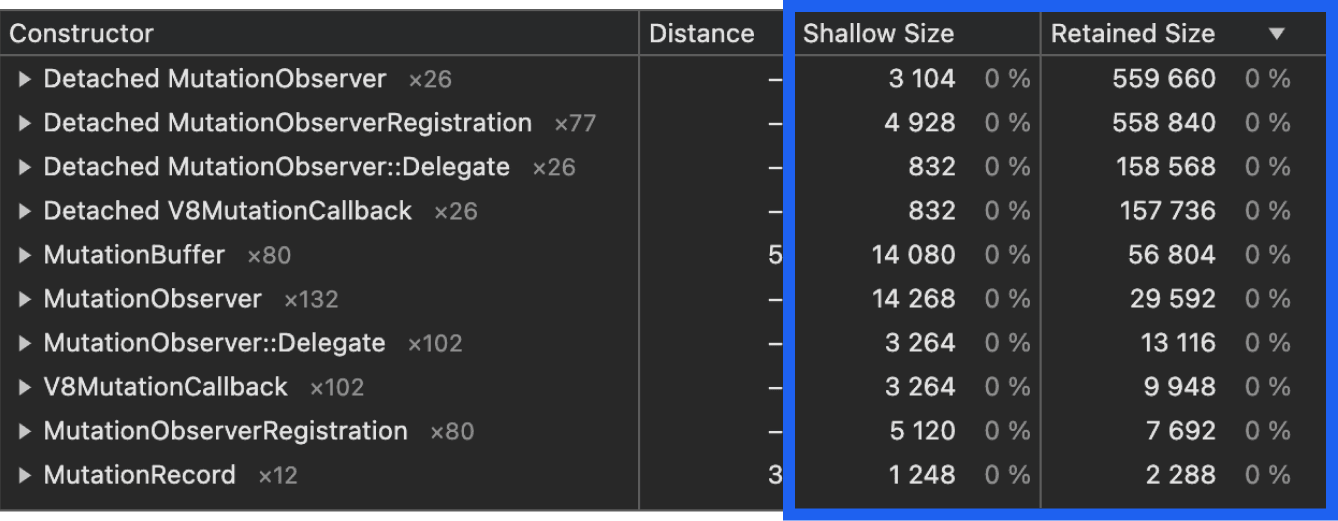
Memory allocation report showing 0% for retained/shallow size.
The important values here are the shallow size, which refers to the amount of memory directly allocated by an object, and the retained size, which refers to both the object’s own memory and the memory of all objects it keeps alive. From a 60s run on the app, we can see that the MutationObserver used by Session Replay to capture DOM changes has a near zero impact on the javascript heap due to the extremely small shallow and retained sizes.
Next, we ran a series of network assessments to better understand bandwidth impact—such as size and time. The size and time of the request is important because large payloads or long-running requests can strain client resources and impact overall browser performance.

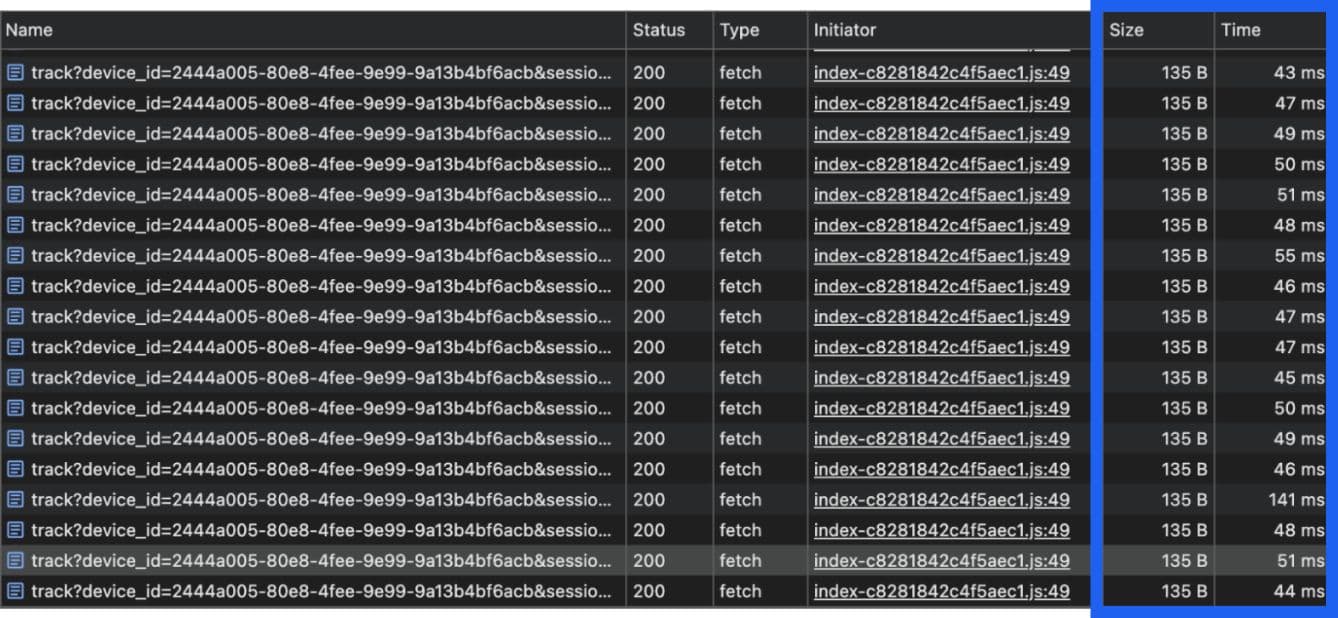
Snapshot of network requests with size ~135 B and time under ~150ms.
From a sample of 15 network requests, we can see that the size of each request is around 135 Bytes, and the latency is under ~150ms. We’ve implemented a batching mechanism to upload events and utilize the lightweight compression library fflate (or fast flate) to compress the events before sending. This prevents Session Replay from constantly uploading single replay events or extremely large event payloads. Combined with our compression, uploading our Session Replay events has a negligible impact on the network latency.
Our tests ultimately show that Session Replay has minimal impact on both memory and network performance. By implementing event batching and lightweight compression using the fflate library, we ensure that Session Replay uploads are efficient, avoiding frequent or large payload uploads, thus maintaining a low impact on network bandwidth and browser performance overall.
Assessing the real-world impact of Session Replay on user experience
While it’s beneficial to understand the impact Session Replay has on browser performance—specifically memory and network performance—the most important part of a product experience is the overall customer experience. There are several different ways to measure the customer’s overall experience on a web page that offer different perspectives on the overall experience. We leveraged a few tools that helped us better understand the overall impact of Session Replay on our customers.
So, how exactly can we measure the user’s experience? We used a tool called Lighthouse, created by Google, that provides a standardized performance profile for each page of your application.
Lighthouse offers several modes to run audits, with "Navigation" and "Timespan" being two primary options.
Navigation is the default mode in Lighthouse. It measures a page's performance as it loads initially. This mode captures metrics related to the loading experience from the start to the end of the page load, providing a holistic view of the page's perceived performance. Timespan mode allows developers to start and stop the collection of performance data at arbitrary times. This mode is useful for analyzing user interactions and other tasks that occur after the initial page load.
Navigation analysis run in Lighthouse

The two Lighthouse tests (running the Navigation test with and without the Session Replay plugin) provide very similar metrics.
So, what do all these metrics mean?
First Contentful Paint (FCP): This measures how long the browser takes to render the first piece of DOM content after a user navigates to your page. Images, non-white <canvas> elements, and SVGs on your page are considered DOM content; anything inside an iframe isn't included.
Largest Contentful Paint (LCP): This measures when the largest content element in the viewport is rendered to the screen. This approximates when the main content of the page is visible to users.
Total Blocking Time: This measures load responsiveness, specifically, the total time after First Contentful Paint (FCP) when the main thread was blocked for long enough to prevent responses to user input. A low TBT helps ensure that the page is usable.
In the context of our Session Replay plugin, we are primarily concerned with FCP, LCP, and TBT. This gives us insight into whether Session Replay could block any important components or DOM content from loading quickly. From a quick look into the Lighthouse test, we noticed that the FCP and LCP took slightly longer ~0.1s to reach the first DOM and ~0.2s to reach the LCP.
However, since the Navigation Lighthouse test is a holistic view of the initial load time, it doesn’t provide us with the granular details that we need to determine the actual impact of Session Replay in this scenario. So, after running the test on the initial load speed and determining that there could possibly be an impact, we turn to the Timeline Lighthouse test to gauge the impact of Session Replay’s individual functions.
Timespan analysis
The Timespan mode allows us to start and stop the collection of performance data at arbitrary times. This mode is useful for analyzing user interactions and other tasks that occur after the initial page load. The Timespan test will provide a performance analysis trace that we can use to analyze and see the latency of specific Session Replay functions. The trace measures the functions' performance timings during the interaction time period. The data point we are most concerned with is the timing measured in milliseconds. Since Session Replay optimizes replay capture by serializing the initial DOM and any changes (mutations) that occur afterward, we will focus on the functions fired during page load and any component interactions. For context, Paul Buchheit, the creator of Gmail, stated that interactions under 100ms will have no visible impact on a user’s experience and feel instantaneous, so this is our bar for success.

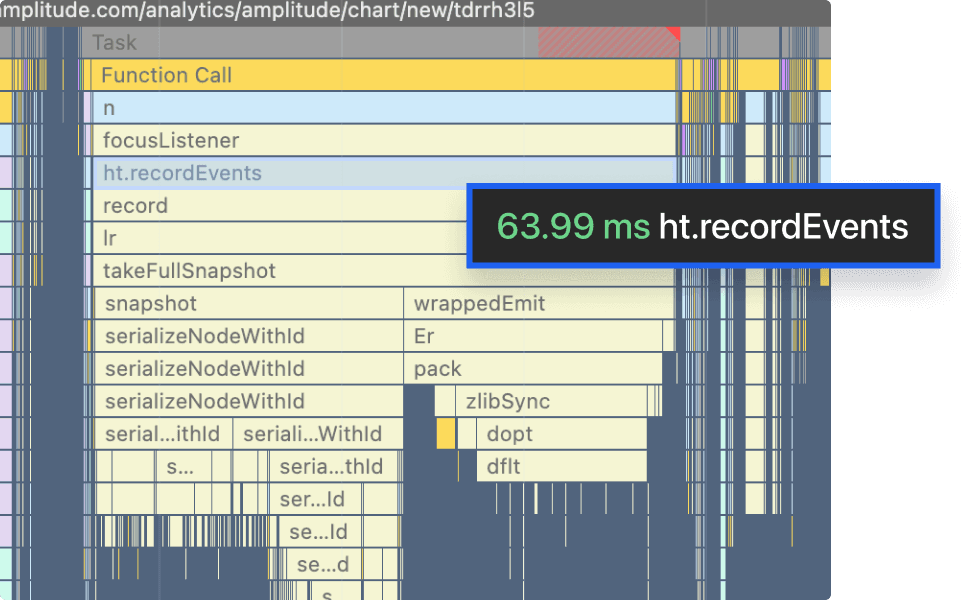
Capturing the initial DOM takes under 100ms.
The recordEvents function fires when Session Replay needs to take a snapshot of the current DOM. This usually has the most impact when fired on first page loads since it will attempt to serialize the entire DOM. Here, the function takes about 64ms, which falls well under the 100ms recommended guideline.
Now what about the function that captures the diffs in the DOM for reconstruction later? We can see that with the processMutations function, which will fire more often to ensure changes to the DOM are captured.

Capturing incremental changes takes under 100ms.
Here, we can see that the impact is much smaller at ~11ms than in the recordEvents function above. We use the MutationObserver API to listen for changes in the DOM tree. The API records additions or removals of DOM elements, attribute modifications, and changes in text content. Since this function runs more often, we want to ensure low latency.
The bottom line: Minimal impact, maximum confidence
Our comprehensive analysis using Chrome DevTools, Lighthouse tests, and detailed performance traces demonstrates that while Amplitude Session Replay's impact isn't zero, it's remarkably minimal and well within optimal user experience thresholds. The data speaks for itself: DOM snapshots take just 64ms, mutation captures average around 11ms, and network payloads are a mere 135 bytes with latencies under 150ms—all well below Paul Buchheit's 100ms threshold for "instantaneous" user experience.
Through efficient event batching and lightweight compression using fflate, we've ensured that Session Replay maintains high performance without compromising your application's responsiveness. While we recommend optimizing your application to minimize unnecessary re-renders and DOM changes, you can implement Session Replay with confidence, knowing it won't impact your users' experience.
Ready to see Session Replay’s insights for yourself? Get started with Amplitude for free today.

Jesse Wang
Senior Software Engineer, Amplitude
Jesse is an engineer on the Session Replay team, specializing in the core product and SDK. With years of experience across multi-stage startups, he excels at driving product development from concept to launch and optimizing the product for high performance and a seamless user experience.
More from Jesse


