Platform

AI

AI Agents
Sense, decide, and act faster than ever before
AI Visibility
See how your brand shows up in AI search
AI Feedback
Distill what your customers say they want
Amplitude MCP
Insights from the comfort of your favorite AI tool

Insights

Product Analytics
Understand the full user journey
Marketing Analytics
Get the metrics you need with one line of code
Session Replay
Visualize sessions based on events in your product
Heatmaps
Visualize clicks, scrolls, and engagement

Action

Guides and Surveys
Guide your users and collect feedback
Feature Experimentation
Innovate with personalized product experiences
Web Experimentation
Drive conversion with A/B testing powered by data
Feature Management
Build fast, target easily, and learn as you ship
Activation
Unite data across teams

Data

Warehouse-native Amplitude
Unlock insights from your data warehouse
Data Governance
Complete data you can trust
Security & Privacy
Keep your data secure and compliant
Integrations
Connect Amplitude to hundreds of partners
Solutions
Solutions that drive business results
Deliver customer value and drive business outcomes
Amplitude Solutions →

Industry

Financial Services
Personalize the banking experience
B2B
Maximize product adoption
Media
Identify impactful content
Healthcare
Simplify the digital healthcare experience
Ecommerce
Optimize for transactions

Use Case

Acquisition
Get users hooked from day one
Retention
Understand your customers like no one else
Monetization
Turn behavior into business

Team

Product
Fuel faster growth
Data
Make trusted data accessible
Engineering
Ship faster, learn more
Marketing
Build customers for life
Executive
Power decisions, shape the future

Size

Startups
Free analytics tools for startups
Enterprise
Advanced analytics for scaling businesses
Resources

Learn

Blog
Thought leadership from industry experts
Resource Library
Expertise to guide your growth
Compare
See how we stack up against the competition
Glossary
Learn about analytics, product, and technical terms
Explore Hub
Detailed guides on product and web analytics

Connect

Community
Connect with peers in product analytics
Events
Register for live or virtual events
Customers
Discover why customers love Amplitude
Partners
Accelerate business value through our ecosystem

Support & Services

Customer Help Center
All support resources in one place: policies, customer portal, and request forms
Developer Hub
Integrate and instrument Amplitude
Academy & Training
Become an Amplitude pro
Professional Services
Drive business success with expert guidance and support
Product Updates
See what's new from Amplitude

Tools

Benchmarks
Understand how your product compares
Templates
Kickstart your analysis with custom dashboard templates
Tracking Guides
Learn how to track events and metrics with Amplitude
Maturity Model
Learn more about our digital experience maturity model
Pricing
LoginContact salesGet started

AI

AI AgentsAI VisibilityAI FeedbackAmplitude MCP

Insights

Product AnalyticsMarketing AnalyticsSession ReplayHeatmaps

Action

Guides and SurveysFeature ExperimentationWeb ExperimentationFeature ManagementActivation

Data

Warehouse-native AmplitudeData GovernanceSecurity & PrivacyIntegrations
Amplitude Solutions →

Industry

Financial ServicesB2BMediaHealthcareEcommerce

Use Case

AcquisitionRetentionMonetization

Team

ProductDataEngineeringMarketingExecutive

Size

StartupsEnterprise

Learn

BlogResource LibraryCompareGlossaryExplore Hub

Connect

CommunityEventsCustomersPartners

Support & Services

Customer Help CenterDeveloper HubAcademy & TrainingProfessional ServicesProduct Updates

Tools

BenchmarksTemplatesTracking GuidesMaturity Model
LoginSign Up

Pivoting Data Tables

Learn how to pivot your Amplitude data using the new pivot feature in Data Tables.
Product

Jan 31, 2023

5 min read

Adam Greco

Adam Greco

Former Product Evangelist, Amplitude

Pivoting Data Tables

When Amplitude introduced its new Data Tables reporting interface, it created a new way for Amplitude customers to visualize their data. Data Tables allow customers to add multiple events/metrics to a table and see them side by side. Data Tables also provide a way to view events/metrics by multiple properties through property breakdowns.

Since its launch, Data Tables has quickly become the fourth most popular data visualization in Amplitude’s analytics product. This is the fastest that a new visualization has risen in popularity over the past ten years! We expect the Data Table visualization to be even more popular when more customers discover it over time.

But like everything in Amplitude, our customers always ask us for more. Amplitude prides itself on listening to customer feedback and using that feedback to improve its product. As a product-led growth company, we believe that our customers’ feedback is the fuel that helps us continuously build better products.

One of the feature requests we received from customers related to Data Tables was the ability to pivot the columns and rows. Many customers are experts in spreadsheet pivot tables and wanted to bring that functionality into Amplitude. The ability to pivot Data Tables just went live, so in this post, I will share how it works and provide an example of its use.

Data Tables

For those not familiar, Amplitude Data Tables are useful when you want to view multiple metrics/events side by side or different variations of a metric/event. For example, you may want to see Lead Form Completions from different cities. To do this, you would add the Lead Form Completed metric/event to the table and then add a different cohort for the cities you want to focus on. In addition, the columns of metrics/events can also be broken down by your Amplitude properties. Property values are typically added in the leftmost column as you might in a spreadsheet. For example, you might want to view the Lead Form Completed metric/event by the day of the week on which the event occurred. If you bring all of this together into a Data Table, you might have a view like this:

Pivot-Table-1

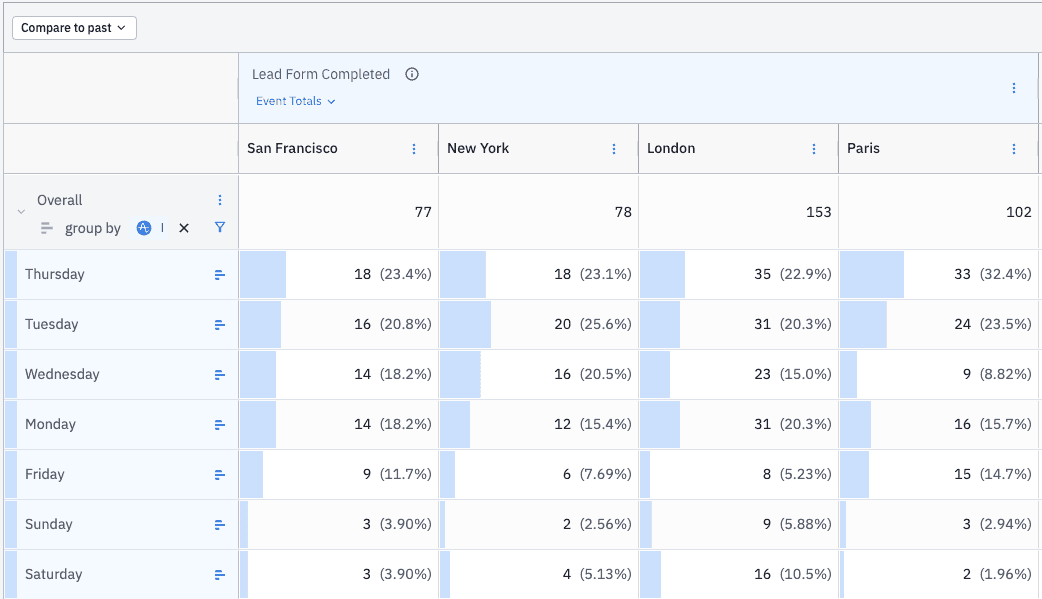
The Data Table shown above makes it easy to see the intersection of City and Day of Week for Lead Form Completions. But there may be times when you would want to pivot this data to see the columns as rows and the rows as columns. One way to do this would be to export the Data Table to a CSV file and create a pivot table there, but at Amplitude, we are fans of keeping people in our product. Once you take data out of Amplitude, it becomes more difficult to dig deeper into the data and ask secondary and tertiary questions.

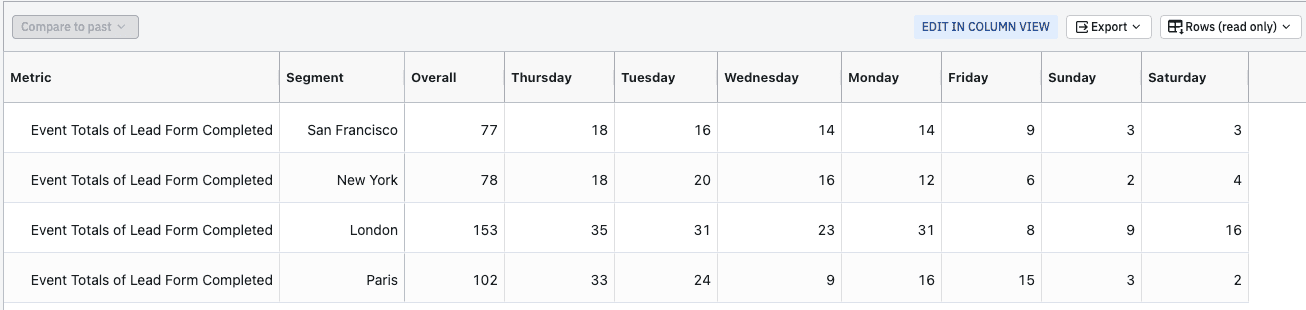
As mentioned earlier, we have made it easy to pivot Data Tables by simply clicking a button. Here is how the preceding table can be pivoted:

Pivot

Once the Data Table has been pivoted, you can resize one or all columns or use the auto-fit function to size each column appropriately. Here is what the resulting Data Table might look like after being pivoted:

Pivot-Data-2

If needed, you can also rearrange the order of the columns to meet your needs. For example, you may want to reorganize the Day of Week columns to be in a more logical order. This can be done by simply dragging the columns as needed. You can choose to sort on any column. If needed, you can export the data once data is pivoted.

Pivot-Reorder

The Fine Print

There are some situations where pivoting data in Data Tables is not feasible. Typically, these are situations where you perform more advanced reporting in Data Tables, and pivoting the data would produce complex results. These include:

  • Using session metrics
  • Using metrics with attribution applied
  • Using rows that have nested properties
  • Using columns that show non-absolute numbers

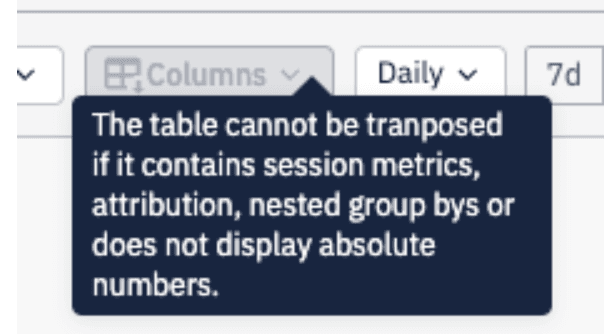
If you have one of these scenarios in your Data Table, the pivot function will be disabled and you will see the following warning:

Pivot-Warning

Other Pivot Table Use Cases

While pivoting data can be useful for visualizing your data in different ways, there are some specific use cases where pivoting Data Tables can be especially helpful:

  • If you have many metrics/events you want to view together and don’t have a need to break these events down by a property, viewing events as rows instead of columns allows you to view more on one screen (vertically instead of horizontally)

Events-Rows
  • Viewing metrics/events as rows instead of columns so you can use the sort function to view events by volume (descending or ascending)

Sort-Metrics
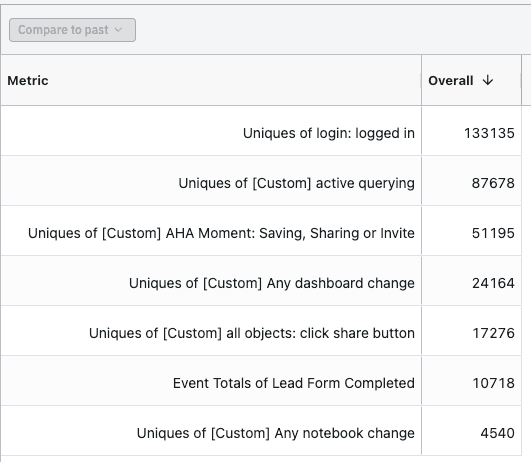
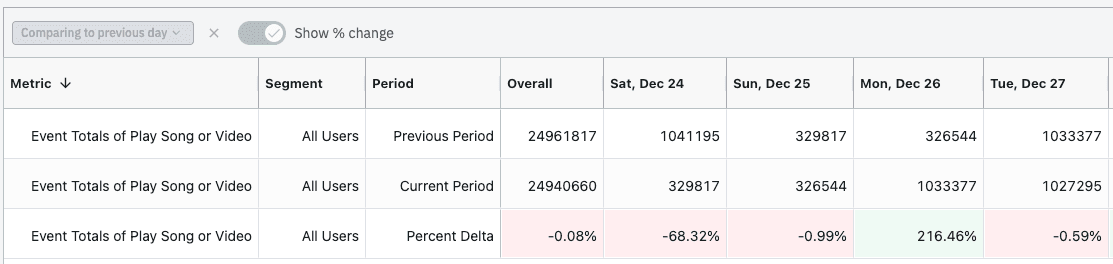
  • Viewing dates as columns instead of rows is a good way to see data over time. For example, you may create a Data Table that looks like this:

Date-Pivot-1

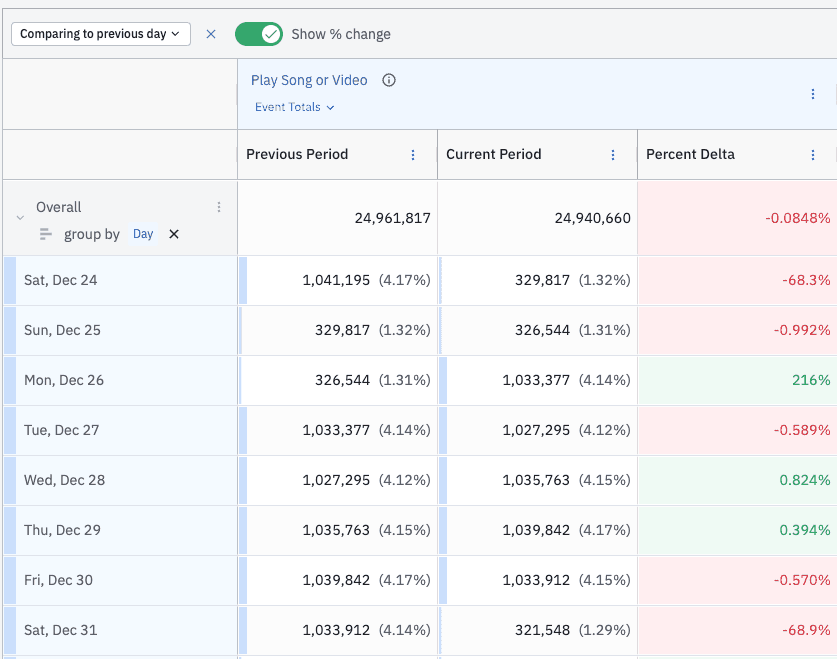
Then you can pivot the data to look like this:

Date-Pivot-2

We look forward to seeing how our customers take advantage of this new pivot functionality!

Amplitude's blog image
About the author
Adam Greco

Adam Greco

Former Product Evangelist, Amplitude

More from Adam

Adam Greco is one of the leading voices in the digital analytics industry. Over the past 20 years, Adam has advised hundreds of organizations on analytics best practices and has authored over 300 blogs and one book related to analytics. Adam is a frequent speaker at analytics conferences and has served on the board of the Digital Analytics Association.

More from Adam
Topics

Amplitude Analytics

Analytics

Data

Platform
  • Product Analytics
  • Feature Experimentation
  • Feature Management
  • Web Analytics
  • Web Experimentation
  • Session Replay
  • Activation
  • Guides and Surveys
  • AI Agents
  • AI Visibility
  • AI Feedback
  • Amplitude MCP
Compare us
  • Adobe
  • Google Analytics
  • Mixpanel
  • Heap
  • Optimizely
  • Fullstory
  • Pendo
Resources
  • Resource Library
  • Blog
  • Product Updates
  • Amp Champs
  • Amplitude Academy
  • Events
  • Glossary
Partners & Support
  • Contact Us
  • Customer Help Center
  • Community
  • Developer Docs
  • Find a Partner
  • Become an affiliate
Company
  • About Us
  • Careers
  • Press & News
  • Investor Relations
  • Diversity, Equity & Inclusion
Terms of ServicePrivacy NoticeAcceptable Use PolicyLegal
EnglishJapanese (日本語)Korean (한국어)Español (Spain)Português (Brasil)Português (Portugal)FrançaisDeutsch
© 2025 Amplitude, Inc. All rights reserved. Amplitude is a registered trademark of Amplitude, Inc.

Recommended Reading

article card image
Read 
Product
Getting Started: Product Analytics Isn’t Just for Analysts

Dec 5, 2025

5 min read

article card image
Read 
Insights
Vibe Check Part 3: When Vibe Marketing Goes Off the Rails

Dec 4, 2025

8 min read

article card image
Read 
Customers
How CAFU Tripled Engagement and Boosted Conversions 20%+

Dec 4, 2025

8 min read

article card image
Read 
Customers
The Future is Data-Driven: Introducing the Winners of the Ampy Awards 2025

Dec 2, 2025

6 min read

Explore Related Content

Integration
Using Behavioral Analytics for Growth with the Amplitude App on HubSpot

Jun 17, 2024

10 min read

Personalization
Identity Resolution: The Secret to a 360-Degree Customer View

Feb 16, 2024

10 min read

Product
Inside Warehouse-native Amplitude: A Technical Deep Dive

Jun 27, 2023

15 min read

Guide
5 Proven Strategies to Boost Customer Engagement

Jul 12, 2023

Video
Designing High-Impact Experiments

May 13, 2024

Startup
9 Direct-to-consumer Marketing Tactics to Accelerate Ecommerce Growth

Feb 20, 2024

10 min read

Growth
Leveraging Analytics to Achieve Product-Market Fit

Jul 20, 2023

10 min read

Product
iFood Serves Up 54% More Checkouts with Error Message Makeover

Oct 7, 2024

9 min read

Blog
InsightsProductCompanyCustomers
Topics

101

AI

APJ

Acquisition

Adobe Analytics

Amplify

Amplitude Academy

Amplitude Activation

Amplitude Analytics

Amplitude Audiences

Amplitude Community

Amplitude Feature Experimentation

Amplitude Guides and Surveys

Amplitude Heatmaps

Amplitude Made Easy

Amplitude Session Replay

Amplitude Web Experimentation

Amplitude on Amplitude

Analytics

B2B SaaS

Behavioral Analytics

Benchmarks

Churn Analysis

Cohort Analysis

Collaboration

Consolidation

Conversion

Customer Experience

Customer Lifetime Value

DEI

Data

Data Governance

Data Management

Data Tables

Digital Experience Maturity

Digital Native

Digital Transformer

EMEA

Ecommerce

Employee Resource Group

Engagement

Event Tracking

Experimentation

Feature Adoption

Financial Services

Funnel Analysis

Getting Started

Google Analytics

Growth

Healthcare

How I Amplitude

Implementation

Integration

LATAM

Life at Amplitude

MCP

Machine Learning

Marketing Analytics

Media and Entertainment

Metrics

Modern Data Series

Monetization

Next Gen Builders

North Star Metric

Partnerships

Personalization

Pioneer Awards

Privacy

Product 50

Product Analytics

Product Design

Product Management

Product Releases

Product Strategy

Product-Led Growth

Recap

Retention

Startup

Tech Stack

The Ampys

Warehouse-native Amplitude