Correlation vs Causation: Learn the Difference
Correlation and causation can exist simultaneously, but correlation doesn’t mean causation. Learn how to test for causation with experimentation.
Originally published on July 17, 2024
Browse by category
Correlation is when two variables appear to change in sync. For example, one might decrease as the other increases or vice versa. Causation means one variable directly influences another—for instance, one variable increases because the other decreases.
In statistics, correlation expresses the degree to which two variables change with one another, but it doesn’t indicate that one variable is causing the other’s change. Testing and analysis confirm whether two variables are merely correlated or have a cause-and-effect relationship.
In product analytics, understanding the difference between correlation and causation is crucial. It can be the difference between squandering resources on low-value features and creating a high-value product that customers love.
Correlational relationships help you reveal patterns in user behavior; for instance, users with more notifications activated in your app might correlate to them spending more time in it.
However, without testing for causation, you don’t know whether the variables influence each other. For example, do notifications actually cause people to spend longer in the app? Or do power users—who already love your app— also happen to activate more notifications? If the latter is true, the two factors are correlated, but the notifications don’t cause increased usage.
Read on to learn more about correlation and causation, plus how to identify causation in a digital product.
Key takeaways
- Correlation is a situation where two variables move together, but this relationship does not necessarily indicate causality.
- Causation describes a direct relationship where changes in one variable directly result in changes in another.
- Misinterpreting correlation as causation in product analytics can lead to ineffective strategies and wasted resources.
- Hypothesis testing and controlled experiments like A/B testing help rule out false positives and confirm relationships.
What’s the difference between correlation and causation?
While causation and correlation can exist simultaneously, correlation does not imply causation. Causation means action A causes outcome B.
On the other hand, correlation is simply a relationship where action A relates to action B—but one event doesn’t necessarily cause the other event to happen.

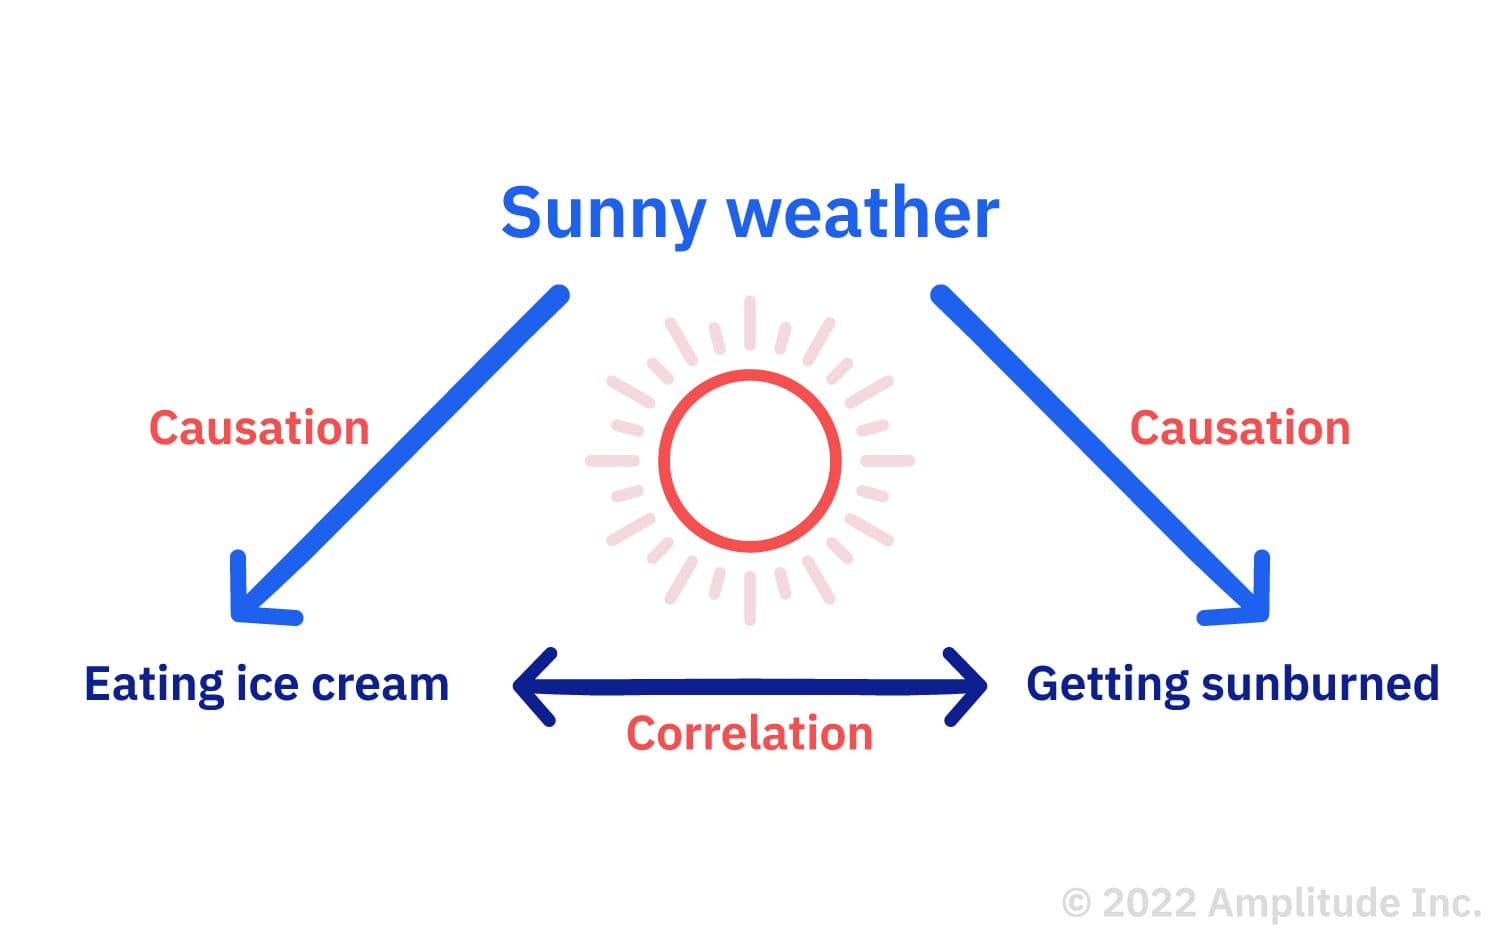
This example shows a correlation between eating ice cream and getting sunburned because the two events are related. But neither event causes the other. Instead, both events are caused by something else—sunny weather.
Many people confuse correlation and causation because our minds like to find explanations for seemingly related events, even when they don’t exist. We usually fabricate these explanations when two variables appear so closely associated that one depends on the other. That would imply a cause-and-effect relationship, where one event results from another.
However, we cannot simply assume causation even when we see two events happening in tandem. Why? First, our observations are purely anecdotal. Second, there are several other possibilities for their association, including:
- The opposite is true: B causes A.
- The two are correlated, but there’s more to it: A and B are correlated but caused by C.
- There’s a third variable involved: A does cause B—as long as D happens.
- There is a chain reaction: A causes E, which leads E to cause B.
Why it’s important to distinguish between correlation and causation
Assuming correlation is actually causation without investigating the relationship more closely can lead to poor decision-making. In contrast, when you understand the causal relationship between two variables—or lack thereof—you can make data-driven decisions and effectively allocate your resources.
Let’s say a local government looks at the ice cream sales data above: there’s a correlation between ice cream and sunburns. However, they assume that the ice cream is causing sunburns and implement a new policy that bans ice cream. Of course, this policy is misdirected and unnecessary because the two variables are only correlated—not causally connected.
An example of correlation vs. causation in product analytics
You might expect causality in your product, where specific user actions or behaviors result in a particular outcome.
Picture this: You just launched a new version of your music-streaming mobile app. You hypothesize that customer retention is linked to in-app social behaviors and ask your team to develop a new feature that allows users to join “communities.”
A month after you release your new community feature, adoption sits at about 20%. You’re curious whether communities impact retention, so you create two equally-sized groups (cohorts) with randomly selected users. One cohort has users who joined a community, and the other has users who didn’t.
Your analysis reveals a shocking finding: Users who joined at least one community have higher retention than those who did not join a community.

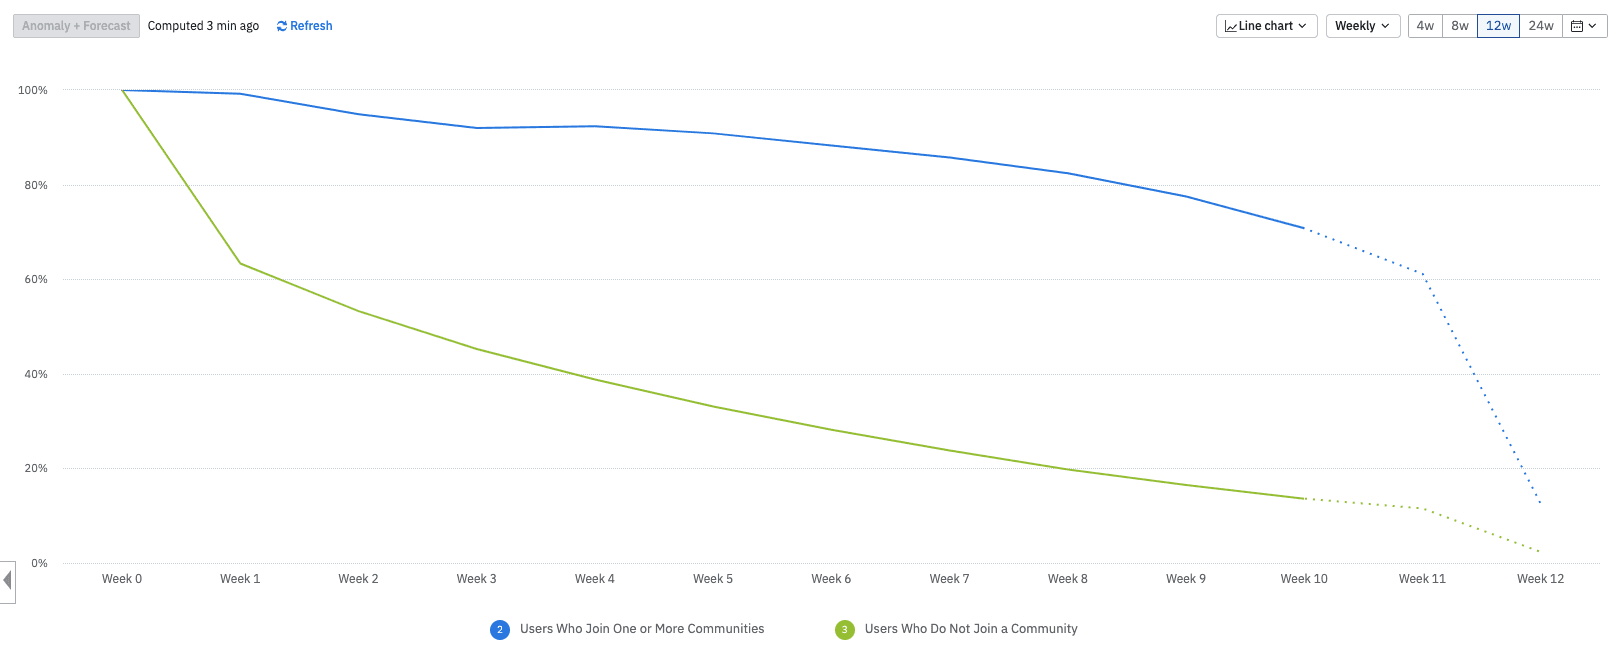
A retention analysis chart in Amplitude. Try creating one yourself for free
In the chart above, nearly 95% of users who joined a community (blue) are still around in Week 2 compared to 55% of those who did not (green). By Week 7, you see 85% retention for those who joined a community and 25% for those who did not. You might be tempted to invest resources to encourage people to join communities to improve retention.
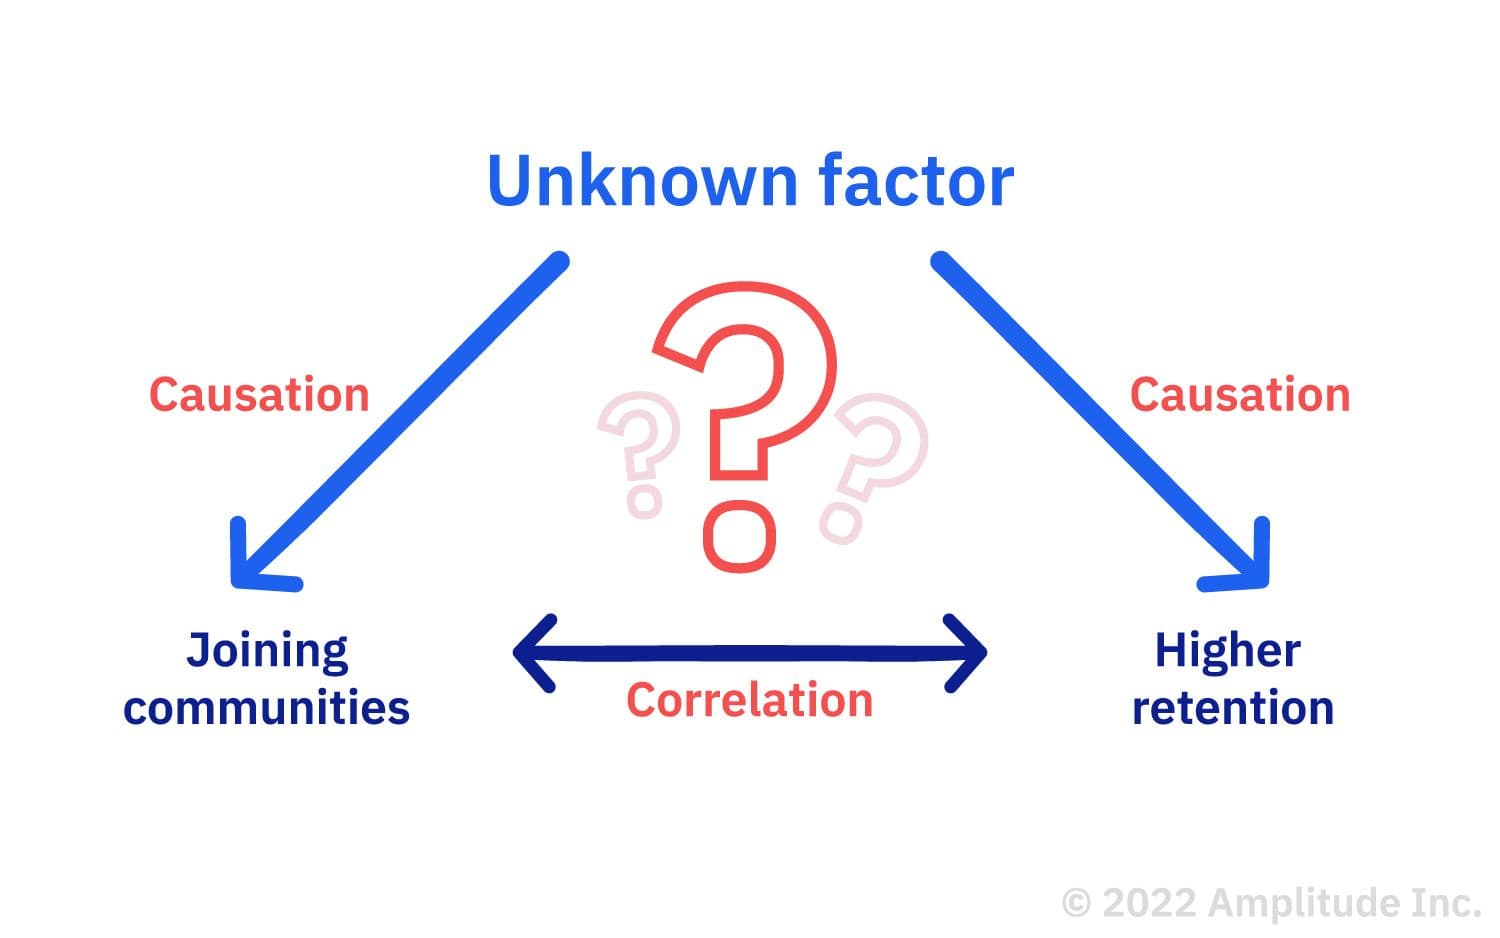
But hold on. You don’t have enough information yet to conclude whether joining communities causes better retention—you just know that the two are correlated. They could both be caused by some other unknown factor.

In this example, joining communities and higher retention correlate, but a third factor could be causing both. To find out, you can conduct statistical analysis by testing for causation in your product.
How to measure the correlation
Statistical correlation quantifies the strength and direction of the relationship between two variables. It’s measured by the ‘correlation coefficient’—1 and -1.
A positive value suggests that the variables are increasing or decreasing together: there’s a positive correlation. A negative value indicates they are moving in the opposite direction (a negative correlation), and 0 means there is no linear relationship.
To measure correlation, start by selecting your variables and gathering data. Use quantitative variables and exclude any outliers from your data set.
Next, use a tool or software like Excel to calculate the coefficient. The Pearson correlation formula is famous for measuring linear relationships between variables.
Then, interpret the result. For the Pearson correlation coefficient, here’s what the different values mean:
|
Pearson correlation coefficient value |
Strength |
Direction |
|
>.5 |
Strong |
Positive |
|
Between 0.3 and 0.5 |
Moderate |
Positive |
|
Between 0 and 0.3 |
Weak |
Positive |
|
0 |
None |
None |
|
Between 0 and -0.3 |
Weak |
Negative |
|
Between -0.3 and -0.5 |
Moderate |
Negative |
|
< -0.5 |
Strong |
Negative |
Remember, the correlation coefficient doesn’t tell us if one variable is causing the other to change. If you notice a positive or negative correlation, investigate whether it’s causal.
How to test for causation in your product
Causal relationships don’t happen by accident.
It can be tempting to assume a cause-and-effect relationship between variables, but doing so without confirming causality can lead to a false positive.
However, rigorous testing enables you to determine causality so you can make critical product decisions based on the correct user behavior.
Once you find a correlation, you can test for causation by running experiments that control the other variables and measure the difference. You can use two experiments to identify causation within your product:
- Hypothesis testing
- A/B/n experiments
1. Hypothesis testing
The most basic hypothesis test will involve an H0 (null hypothesis) and an H1 (your primary hypothesis). You can also have a secondary hypothesis, a tertiary hypothesis, and so on.
The null hypothesis is the opposite of your primary hypothesis. While you cannot prove your primary hypothesis with 100% certainty (the closest you can get is 99%), you can disprove your null hypothesis.
The primary hypothesis points to the causal relationship you’re researching. It identifies a cause (independent variable or exposure variable—the variable you change or control in an experiment) and an effect (dependent variable or outcome variable—the result you measure).
It’s best to create your H1 first and then specify its opposite, your H0. Your H1 identifies the relationship you expect between your independent and dependent variables.
If we use the previous example and look at the impact of in-app social features on retention, your independent variable would be “joining a community,” and your dependent variable would be “retention.” Your primary hypothesis might be:
H1: If a user joins a community within our product in the first month, they will remain customers for over a year.
Then, negate your H1 to generate your null hypothesis:
H0: There is no relationship between joining a community and user retention.
The goal is to observe whether there is an actual difference between your different hypotheses. If you can reject the null hypothesis with statistical significance—ideally with a minimum of 95% confidence—you’re closer to understanding the relationship between your independent and dependent variables.
In the music-streaming example above, you reject the null hypothesis by finding that joining a community resulted in higher retention rates while adjusting for confounding variables. Confounding variables such as age, genre preference, or initial user engagement level could independently influence the results. Considering these, you can conclude that there is some relationship between joining a community and user retention.
To test this hypothesis, develop an equation that accurately reflects the relationship between your expected cause (independent or exposure variable) and effect (dependent or outcome variable). If your model allows you to plug in a value for your exposure variable and consistently return an outcome reflecting actual observed data, you’re probably onto something.
When to use hypothesis testing
Hypothesis testing is helpful when trying to identify whether a relationship exists between two variables rather than looking at anecdotal evidence. Hypothesis testing mainly uses historical data and is ideal for analyzing existing data sets to evaluate theories or hypotheses over time or across different groups.
Consider using historical data to run a longitudinal analysis of changes over time. For example, you might investigate whether first adopters for product launches are your biggest promoters, look at referral patterns, and compare this relationship to product launches.
Or, run a cross-sectional analysis that analyzes a snapshot of data. This analysis is helpful when looking at the effects of a specific exposure and outcome rather than trend changes. For example, explore the relationship between holiday-specific promotions and sales.
2. A/B/n Experimentation
A/B/n testing, or split testing, can bring you from correlation to causation. Look at each variable, change one so you have different versions (variants A and B), and see what happens.
If your outcome consistently changes with the same trend—for example, if variant A consistently leads to higher user engagement than variant B across multiple tests—then you’ve found the variable that makes the difference.

Two variants for a website layout—variant A and variant B
When considering the relationship between joining a community and retention, you must eliminate all other variables that could influence the outcome—because something else might ultimately affect retention.
To test whether there’s causation, establish whether there’s a direct link between users joining a community and using your app long-term.
Start with your onboarding flow. Split the following 1,000 users into two groups. Require the first half to join a community when they sign up (variant A) and the other half not to (variant B). Run the experiment for 30 days using an experimentation tool like Amplitude Experiment, then compare retention rates between the two groups.
Suppose that the users in the group are forced to join a community and have a relatively higher retention rate. You now have evidence to confirm a causal relationship between community joining and retention. From there, consider using a digital analytics platform like Amplitude to dig deeper and understand why communities drive retention.
When to use A/B/n testing
Unlike hypothesis testing based on historical data, A/B/n testing generates new data through controlled experiments. A/B/n is ideal when comparing the impact of variations—variant A and variant B—for campaigns, product features, content strategies, and more.
For example, a split test of your product’s onboarding flow might compare how different product strategies perform based on specific characteristics, including:
- Copy variations
- Graphics (stock photos vs. custom illustrations)
- Reducing the number of fields in a sign-up form
- Personalization (name, company, and industry details)
After running multiple product onboarding variations, you can look at the results and compare metrics such as drop-off rate, conversion, and retention.
Learn more about metrics you can track in The Amplitude Guide to Product Metrics.
Act on correlations and causations for sustained product growth
We’re always looking for explanations and trying to interpret what we see. However, unless you can identify causation through data analysis, assume that you only see a correlation. The more adept you become at identifying accurate correlations within your product, the better you’ll be able to prioritize your product investments and improve retention.
If you’re looking to spot trends in customer behavior, test for causation, and optimize your product all in one platform, try Amplitude for free.
References
- What is A/B Testing? How it Works and When to Use It, Amplitude
- Find your key activation event to prompt onboarding, Clearbit
- Measuring What Matters: How To Pick A Good Metric, OnStartups
- A Refresher on Statistical Significance, Harvard Business Review

Archana Madhavan
Senior Learning Experience Designer, Amplitude
Archana is a Senior Learning Experience Designer on the Customer Education team at Amplitude. She develops educational content and courses to help Amplitude users better analyze their customer data to build better products.
More from Archana


