Platform

AI

AI Agents
Sense, decide, and act faster than ever before
AI Visibility
See how your brand shows up in AI search
AI Feedback
Distill what your customers say they want
Amplitude MCP
Insights from the comfort of your favorite AI tool

Insights

Product Analytics
Understand the full user journey
Marketing Analytics
Get the metrics you need with one line of code
Session Replay
Visualize sessions based on events in your product
Heatmaps
Visualize clicks, scrolls, and engagement

Action

Guides and Surveys
Guide your users and collect feedback
Feature Experimentation
Innovate with personalized product experiences
Web Experimentation
Drive conversion with A/B testing powered by data
Feature Management
Build fast, target easily, and learn as you ship
Activation
Unite data across teams

Data

Warehouse-native Amplitude
Unlock insights from your data warehouse
Data Governance
Complete data you can trust
Security & Privacy
Keep your data secure and compliant
Integrations
Connect Amplitude to hundreds of partners
Solutions
Solutions that drive business results
Deliver customer value and drive business outcomes
Amplitude Solutions →

Industry

Financial Services
Personalize the banking experience
B2B
Maximize product adoption
Media
Identify impactful content
Healthcare
Simplify the digital healthcare experience
Ecommerce
Optimize for transactions

Use Case

Acquisition
Get users hooked from day one
Retention
Understand your customers like no one else
Monetization
Turn behavior into business

Team

Product
Fuel faster growth
Data
Make trusted data accessible
Engineering
Ship faster, learn more
Marketing
Build customers for life
Executive
Power decisions, shape the future

Size

Startups
Free analytics tools for startups
Enterprise
Advanced analytics for scaling businesses
Resources

Learn

Blog
Thought leadership from industry experts
Resource Library
Expertise to guide your growth
Compare
See how we stack up against the competition
Glossary
Learn about analytics, product, and technical terms
Explore Hub
Detailed guides on product and web analytics

Connect

Community
Connect with peers in product analytics
Events
Register for live or virtual events
Customers
Discover why customers love Amplitude
Partners
Accelerate business value through our ecosystem

Support & Services

Customer Help Center
All support resources in one place: policies, customer portal, and request forms
Developer Hub
Integrate and instrument Amplitude
Academy & Training
Become an Amplitude pro
Professional Services
Drive business success with expert guidance and support
Product Updates
See what's new from Amplitude

Tools

Benchmarks
Understand how your product compares
Templates
Kickstart your analysis with custom dashboard templates
Tracking Guides
Learn how to track events and metrics with Amplitude
Maturity Model
Learn more about our digital experience maturity model
Pricing
LoginContact salesGet started

AI

AI AgentsAI VisibilityAI FeedbackAmplitude MCP

Insights

Product AnalyticsMarketing AnalyticsSession ReplayHeatmaps

Action

Guides and SurveysFeature ExperimentationWeb ExperimentationFeature ManagementActivation

Data

Warehouse-native AmplitudeData GovernanceSecurity & PrivacyIntegrations
Amplitude Solutions →

Industry

Financial ServicesB2BMediaHealthcareEcommerce

Use Case

AcquisitionRetentionMonetization

Team

ProductDataEngineeringMarketingExecutive

Size

StartupsEnterprise

Learn

BlogResource LibraryCompareGlossaryExplore Hub

Connect

CommunityEventsCustomersPartners

Support & Services

Customer Help CenterDeveloper HubAcademy & TrainingProfessional ServicesProduct Updates

Tools

BenchmarksTemplatesTracking GuidesMaturity Model
LoginSign Up
Blog
InsightsProductCompanyCustomers
Topics

101

AI

APJ

Acquisition

Adobe Analytics

Amplify

Amplitude Academy

Amplitude Activation

Amplitude Analytics

Amplitude Audiences

Amplitude Community

Amplitude Feature Experimentation

Amplitude Guides and Surveys

Amplitude Heatmaps

Amplitude Made Easy

Amplitude Session Replay

Amplitude Web Experimentation

Amplitude on Amplitude

Analytics

B2B SaaS

Behavioral Analytics

Benchmarks

Churn Analysis

Cohort Analysis

Collaboration

Consolidation

Conversion

Customer Experience

Customer Lifetime Value

DEI

Data

Data Governance

Data Management

Data Tables

Digital Experience Maturity

Digital Native

Digital Transformer

EMEA

Ecommerce

Employee Resource Group

Engagement

Event Tracking

Experimentation

Feature Adoption

Financial Services

Funnel Analysis

Getting Started

Google Analytics

Growth

Healthcare

How I Amplitude

Implementation

Integration

LATAM

Life at Amplitude

MCP

Machine Learning

Marketing Analytics

Media and Entertainment

Metrics

Modern Data Series

Monetization

Next Gen Builders

North Star Metric

Partnerships

Personalization

Pioneer Awards

Privacy

Product 50

Product Analytics

Product Design

Product Management

Product Releases

Product Strategy

Product-Led Growth

Recap

Retention

Startup

Tech Stack

The Ampys

Warehouse-native Amplitude

How to Monitor Digital Business Performance with New Executive Reporting

We reinvented the dashboard for the new digital executive. Go beyond legacy KPIs and measure the metrics that matter.
Product

May 5, 2021

5 min read

Abbie Kouzmanoff

Abbie Kouzmanoff

Former Senior Product Manager, Amplitude

How to Monitor Digital Business Performance with New Executive Reporting

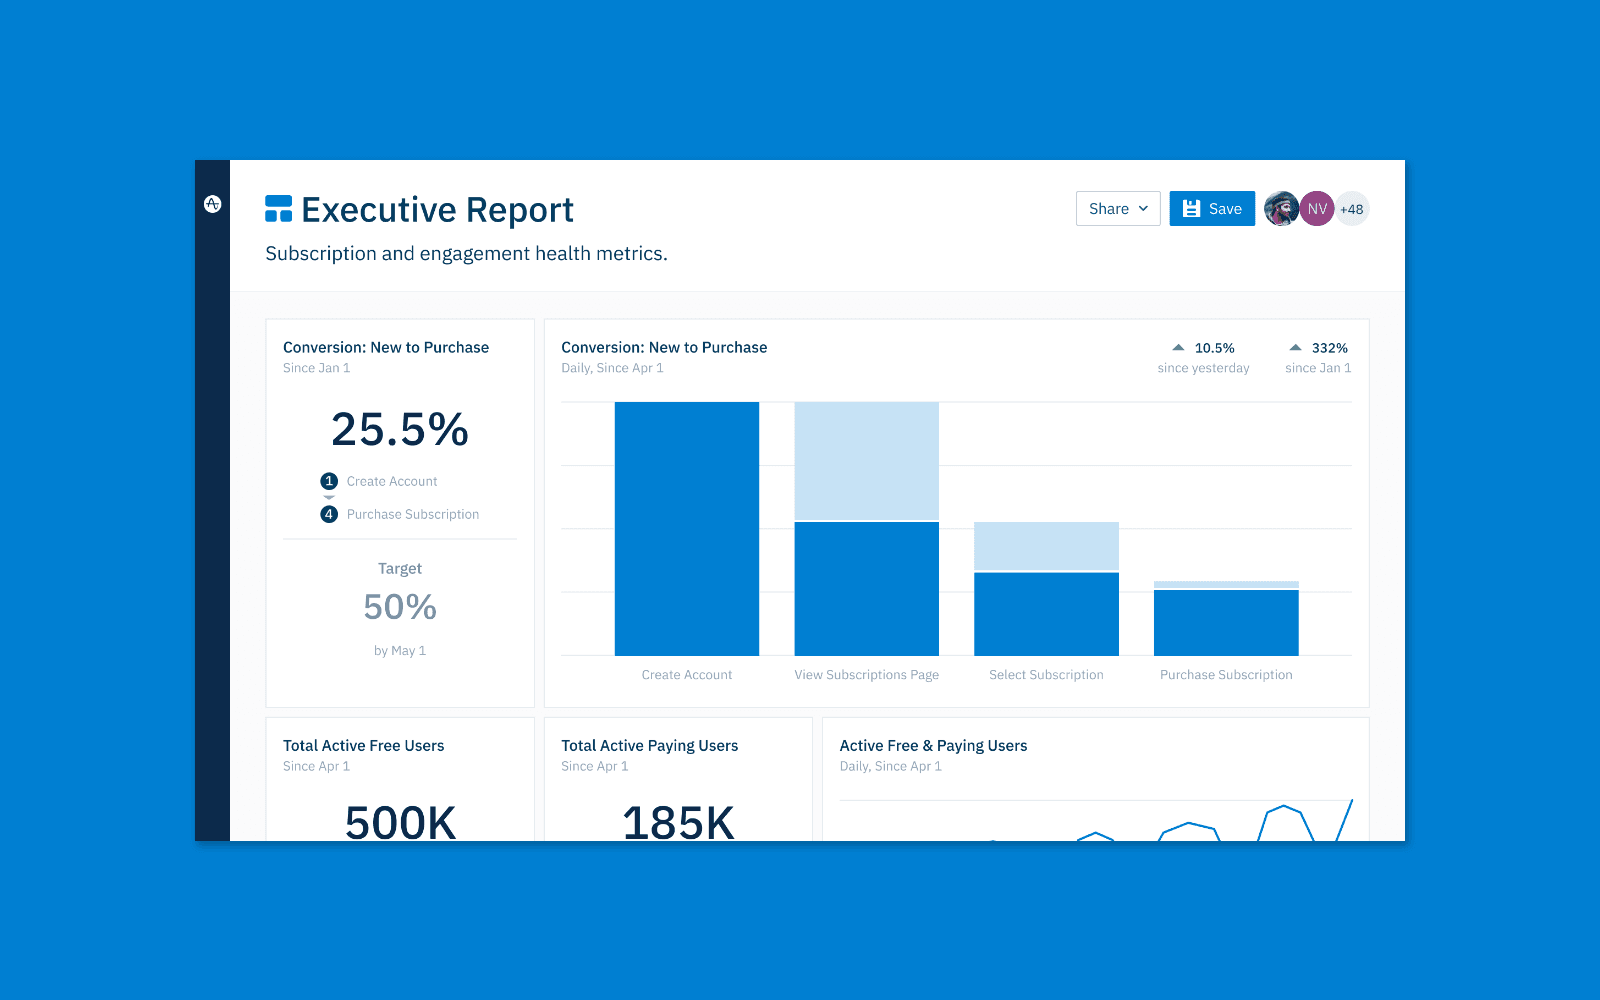
Today, we’re announcing new Executive Reporting, a series of powerful upgrades to our Dashboards that help leaders monitor digital business performance. Customers can now set and track progress to a target metric, add critical context as notes throughout the Dashboard, and more flexibly customize the layout of any report.

Amplitude's blog image

Over the past several years, we’ve seen the rapid emergence of the product-led digital leader. More and more, companies are recognizing that the success of their digital products drive their digital business, and executives are recognizing the importance of connecting business performance to product and customer data. Keeping a pulse on metrics across the customer journey like new user retention and optimizing key product funnels has become essential to growing the business.

Why Legacy Dashboards and KPIs Aren’t Enough

According to the executives surveyed in a new report by Harvard Business Review, where digital leaders once measured success against customer awareness, NPS, and acquisition goals, they now cite user engagement, customer retention rate, and customer lifetime value as their top indicators of success. They set goals and track against them in real-time–and they want to dig into how the bets the product and marketing teams are making are impacting these key digital metrics.

Tracking impressions, website visitors, and surface-level growth numbers in static dashboards no longer suffices as adequate indicators of business health and product success. And executives don’t have time to wait days or weeks to get their question answered on a new cut of the data. As per a report by Gartner’s Sr. Director Analyst Joseph Enever and VP Analyst Lizzy Foo Kune:

“Gartner’s clients continue to express strong interest in designing useful dashboards. Their frustration is clear — they find their current dashboards heavy on numbers and charts, but light on powerful decision support.” According to the report one of the key challenges is that, “Users complain that their dashboards contain a lot of information that’s interesting, but that doesn’t help them make decisions.” It is further mentioned that, “Interactivity is also desirable, if it allows the user to drill down into detail on a specific, higher-level metric.”

The success of digital businesses is centered on optimizing value where customers spend most of their time–the digital product–and a team’s ability to make impactful decisions faster. And that’s why we built a new type of dashboard, built for the digital-first, product-led business leader.

Becoming Your Source for Digital Business Performance with Executive Reporting

As this shift has taken place, our customers have increasingly looked to monitor and track changes against product performance via Amplitude. In Amplitude, critical product metrics such as subscriber retention and free-to-paid conversion can be forecasted and monitored in real-time, and consumers of that data can easily add their own filters to the reporting without the help of an analyst. While a request to add a “region” or “business unit” filter to a report may have taken two weeks with a business intelligence tool, applying new filters is available self-serve on Amplitude Dashboards.

Amplitude's blog image

And now, with a series of upgrades to both our Dashboard and Notebook features, our new Executive Reporting makes Amplitude a source of truth for measuring digital business performance. With better shared insight into what customer behaviors drive business outcomes, teams across the organization can now optimize every part of their digital product experiences to maximize growth.

“Organizational alignment is essential – Amplitude Analytics gives us a shared version of truth and enables orgs to work together. We’re looking at the same data for the first time. It’s our single source of what’s going on in the products.”

—Nilanjan Adhya, Chief Digital Officer at IBM

With the addition of target metrics, better organization and visibility of key charts, and the ability to add critical context to each insight, our Dashboards become the hub for monitoring digital performance. Leaders can easily:

  • Report on product health
  • Track against targets
  • Monitor performance changes over time
  • Drill into critical insights wherever they need them

Amplitude's blog image

Start Monitoring Metrics that Matter

These enhancements are live now. Check out the new Executive Reporting in a demo account, or log into your account to customize Dashboards.

Here are a few ways to get started:

  • Add one, two, three, or up to four charts on the same row, and as many as you want on the page overall.
  • Add a note to any visualization to give your team context on what they should know while consuming your Dashboard, or make a note of how an important metric is defined.
  • Apply property and date filters to Dashboards and see updates in seconds.
  • Set a target to motivate the team and inform consumers on how you’re tracking to your goal. Target metrics are supported on key chart types such as Event Segmentation, Funnels, and Sessions.

To learn more, demo the new Executive Reporting Dashboards or schedule a call with our team today.

About the author
Abbie Kouzmanoff

Abbie Kouzmanoff

Former Senior Product Manager, Amplitude

More from Abbie

Abbie is a former senior product manager at Amplitude, focusing on helping companies adopt product intelligence to ultimately build better products. She was previously a product manager at Dropbox where she drove revenue growth for the company through continuous experimentation and optimization.

More from Abbie
Topics

Metrics

Platform
  • Product Analytics
  • Feature Experimentation
  • Feature Management
  • Web Analytics
  • Web Experimentation
  • Session Replay
  • Activation
  • Guides and Surveys
  • AI Agents
  • AI Visibility
  • AI Feedback
  • Amplitude MCP
Compare us
  • Adobe
  • Google Analytics
  • Mixpanel
  • Heap
  • Optimizely
  • Fullstory
  • Pendo
Resources
  • Resource Library
  • Blog
  • Product Updates
  • Amp Champs
  • Amplitude Academy
  • Events
  • Glossary
Partners & Support
  • Contact Us
  • Customer Help Center
  • Community
  • Developer Docs
  • Find a Partner
  • Become an affiliate
Company
  • About Us
  • Careers
  • Press & News
  • Investor Relations
  • Diversity, Equity & Inclusion
Terms of ServicePrivacy NoticeAcceptable Use PolicyLegal
EnglishJapanese (日本語)Korean (한국어)Español (Spain)Português (Brasil)Português (Portugal)FrançaisDeutsch
© 2025 Amplitude, Inc. All rights reserved. Amplitude is a registered trademark of Amplitude, Inc.

Recommended Reading

article card image
Read 
Customers
The Future is Data-Driven: Introducing the Winners of the Ampy Awards 2025

Dec 2, 2025

6 min read

article card image
Read 
Insights
Marketing Analytics in 2026: Predictions from the People Who Measure Everything

Nov 25, 2025

9 min read

article card image
Read 
Customers
Amplitude Pathfinder: How Dan Grainger Bet on Amplitude & Won

Nov 25, 2025

16 min read

article card image
Read 
Product
Getting Started: Driving Product Engagement by Obsessing Over Activation

Nov 24, 2025

4 min read

Explore Related Content

Integration
Using Behavioral Analytics for Growth with the Amplitude App on HubSpot

Jun 17, 2024

10 min read

Personalization
Identity Resolution: The Secret to a 360-Degree Customer View

Feb 16, 2024

10 min read

Product
Inside Warehouse-native Amplitude: A Technical Deep Dive

Jun 27, 2023

15 min read

Guide
5 Proven Strategies to Boost Customer Engagement

Jul 12, 2023

Video
Designing High-Impact Experiments

May 13, 2024

Startup
9 Direct-to-consumer Marketing Tactics to Accelerate Ecommerce Growth

Feb 20, 2024

10 min read

Growth
Leveraging Analytics to Achieve Product-Market Fit

Jul 20, 2023

10 min read

Product
iFood Serves Up 54% More Checkouts with Error Message Makeover

Oct 7, 2024

9 min read