Release Notes: January 2020
Here's what was new in Amplitude through January 2020: embed Loom videos in Notebooks, view percent change for period-over-period analyses, and uncover drivers of conversion.
Embed Loom videos in your Notebooks
Available for all Scholarship, Growth, and Enterprise customers
Notebooks helps you easily communicate the full context behind complex analyses, A/B tests, and product launches with your whole team. Not only can you embed Amplitude charts directly within Notebooks, you can also upload external images and embed videos. This is especially useful if you’re using Notebooks for training, education, and enablement purposes.
Notebooks supports embedding videos from YouTube, Vimeo, and now, Loom, a free screen and video recording software. For more information on Notebooks, check out our documentation.
Give co-ownership of all of your content to multiple people (admin)
Available for all Scholarship, Growth, and Enterprise admins
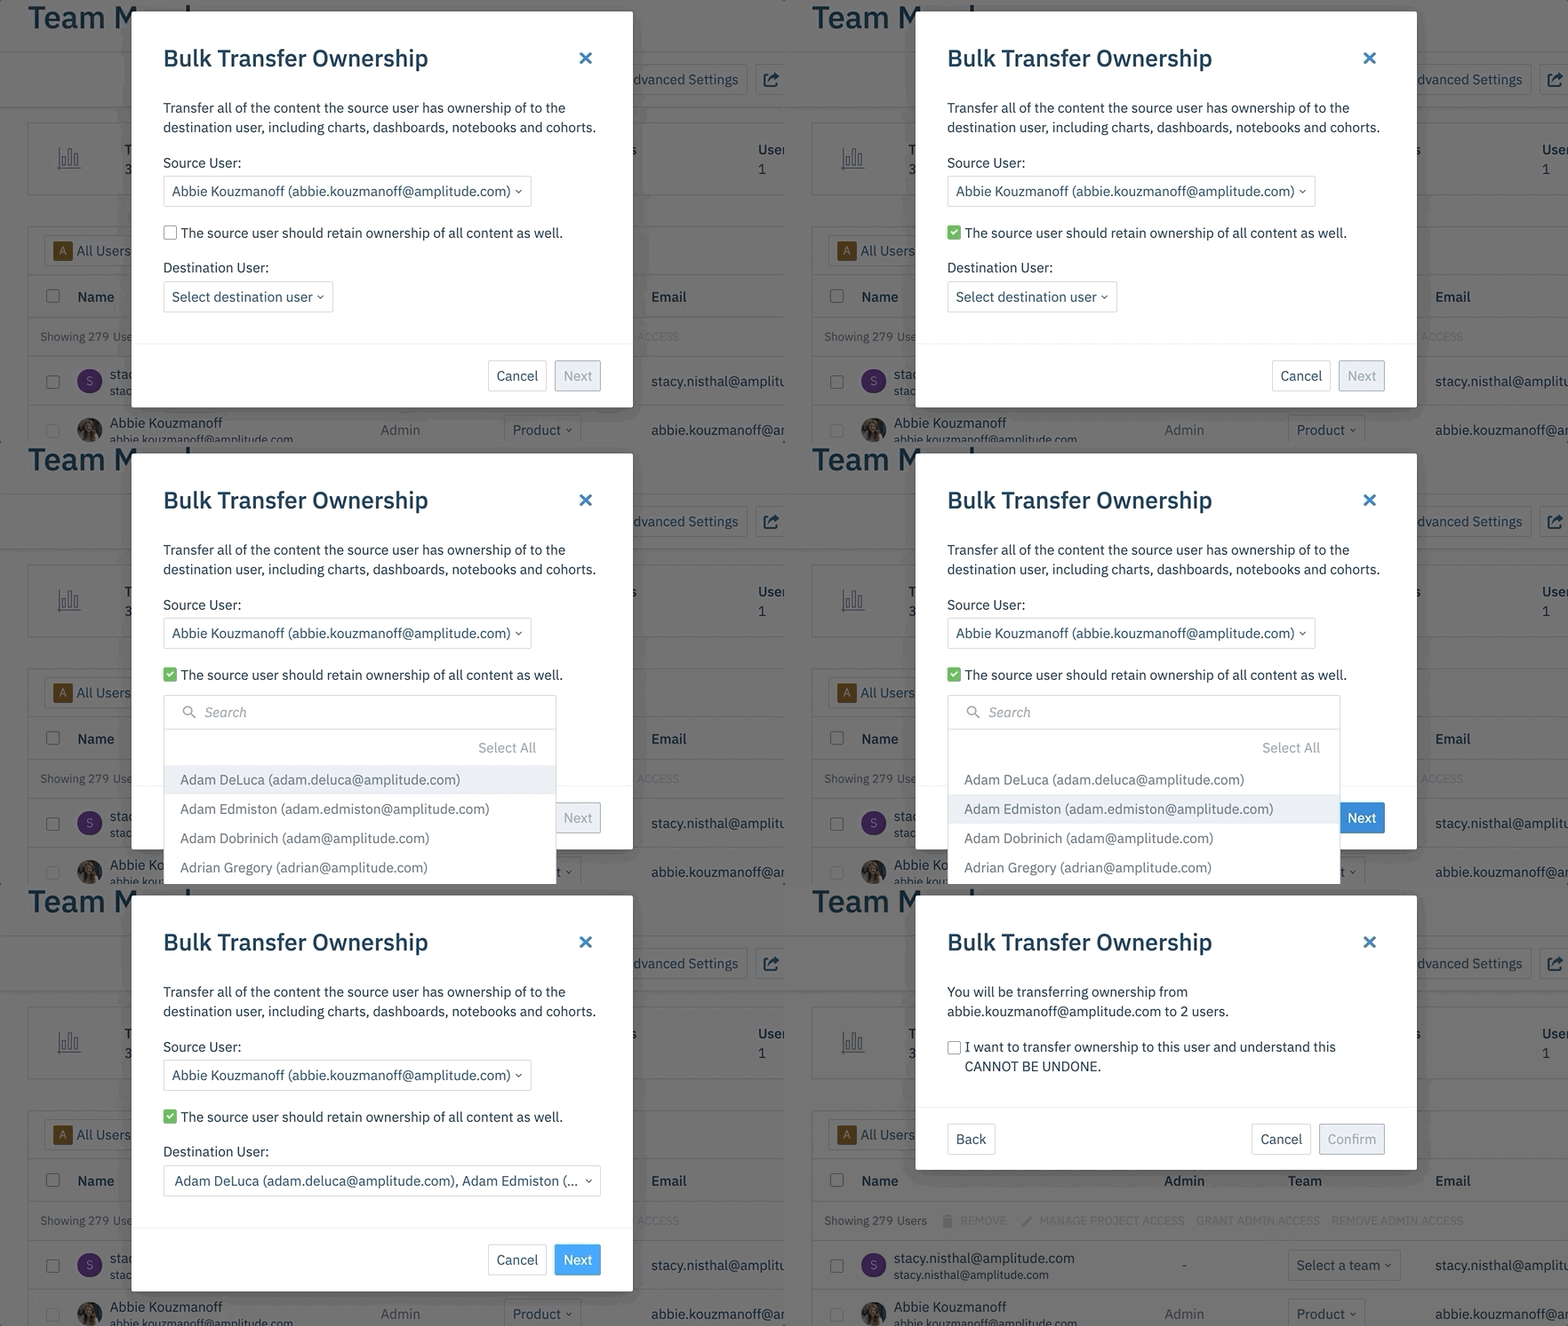
Admins can now easily give multiple people co-ownership of Amplitude inventory. Just open up the bulk transfer modal and select all of your destinations.
This is useful when someone moves to a different team or when a new team member joins; another team member can send all of their graphs and charts to them. For more information on bulk transfer of ownership, check out our documentation.
An example of giving co-ownership of Amplitude inventory.

View percent change from a previous period as a time series
Available for all Scholarship, Growth, and Enterprise customers
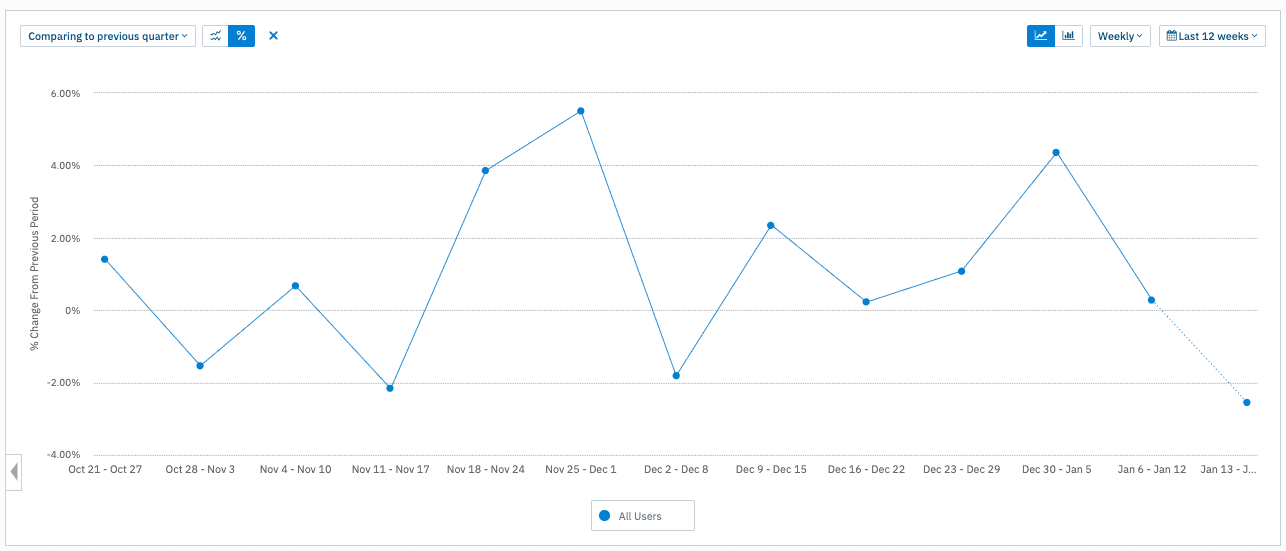
Doing comparative analysis to a previous time period helps you understand how one metric is performing relative to an equivalent time period in the past. This is one of the most valuable ways to draw signals from data. You can now view the percentage change of a metric relative to a previous time period so you can measure trends in growth rate over time. For more information on period-over-period analysis, check out our documentation.
Related Reading: 3 Mistakes You’re Making with Month-Over-Month Growth Rates
Percent change of weekly users compared to the previous quarter.

Investigate behaviors performed before conversion or drop-off
Available for all Scholarship, Growth, and Enterprise customers
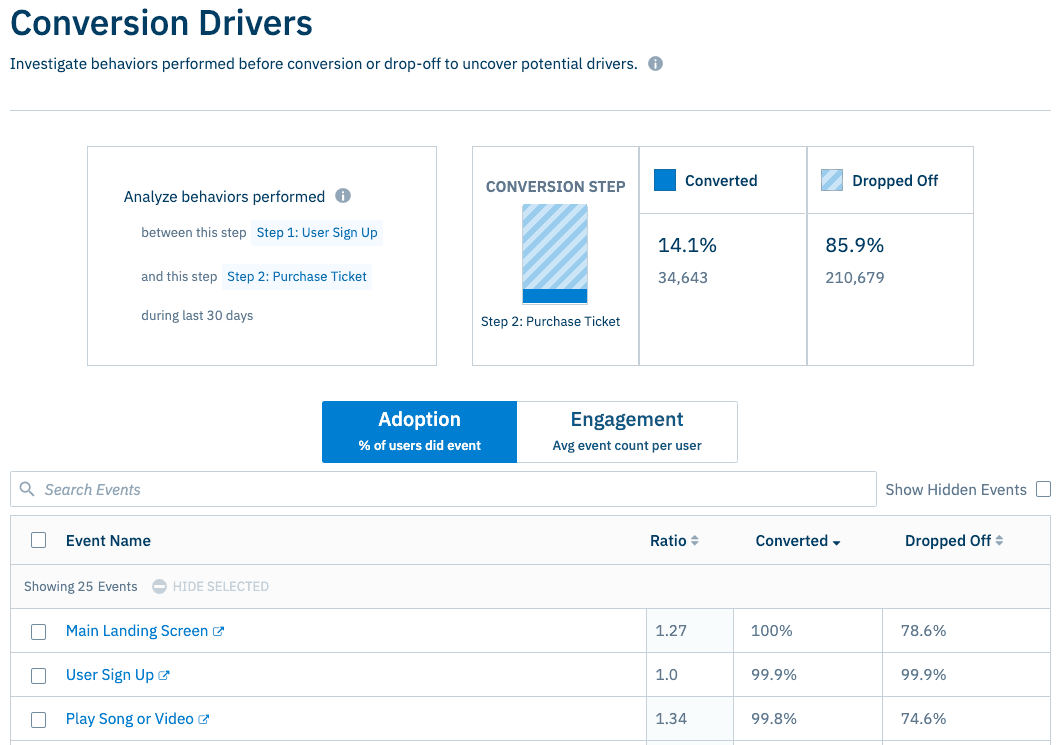
Why do some users end up converting through your critical funnel and while others drop off? With Conversion Drivers, you can begin hypothesizing which user behaviors are important for conversion. Just click into any step of your funnel to open up the Conversion Drivers functionality; you can then choose to analyze the behaviors that happen between two steps of your funnel, or before the conversion step.
Note that this is an update to our Compare Behaviors functionality. While Compare Behaviors surfaced all behaviors that were taken by converted users versus dropped-off users, Conversion Drivers looks at behaviors that were taken between two specific steps in your funnel—this helps reduce noise so you can make stronger inferences about the drivers of conversion. For more information on Conversion Drivers, check out our documentation.
Related Reading: How Instacart Increased Conversion by Understanding User Behavior
Example of Conversion Drivers


Archana Madhavan
Senior Learning Experience Designer, Amplitude
Archana is a Senior Learning Experience Designer on the Customer Education team at Amplitude. She develops educational content and courses to help Amplitude users better analyze their customer data to build better products.
More from Archana


