Impacts of Analytics Reporting Interfaces on Analytics Programs
Does the type of analytics reporting interface matter?


In the analytics world, analysts spend a lot of time in analytics platforms running reports. Each analytics platform has a slightly different approach to reporting. Some analytics platforms start with more of a blank canvas and require the analyst to drag in data elements to conduct analysis. Others allow analysts to import data into spreadsheets. Some require the use of SQL. Some provide report templates that allow analysts to fill in the blank with events and properties. While no digital analytics platform reporting interface is necessarily better than another, it is important that organizations choose the one that best suits their organization and its data consumers. The reporting interface can have consequential impacts on the analytics program as a whole. In this post, I will outline some of the analytics reporting interfaces I have seen and how they can impact analytics delivery models and programs.
Freeform Reporting
One of the most popular analytics reporting interfaces is what I call freeform reporting. In this reporting interface, analysts are presented with a blank canvas and can drag or select metrics and dimensions. As data elements are added to the canvas, data takes the form of a table with columns and rows. This approach was popularized by BI tools like Tableau and digital analytics products like Adobe and Google Analytics.
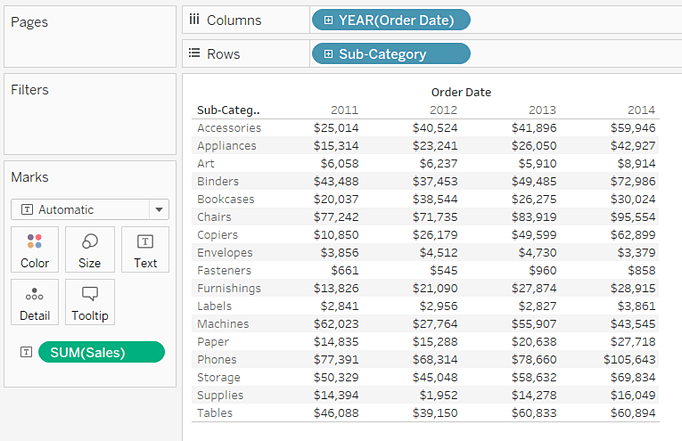
The benefit of freeform reporting interfaces is that you have complete control over the structure of the data you want to analyze. You can create multiple levels of breakdown and can often add filters to narrow down data by dimension values. Power analysts like this model because it provides a lot of freedom and the ability to do some advanced queries without having to know SQL.
Prescriptive Reporting
Another analytics reporting interface is prescriptive reporting. This model provides a framework for the type of analysis being done and allows analysts to enter the items needed for the report to run. I like to think of this model as a “fill in the blank” approach to reporting. Each report type knows what type of metrics, events or dimensions/properties are needed and allows analysts to choose from eligible options to create the report.
This approach can be limiting in some ways, but it also prevents analysts from making too many mistakes due to its structure.
Spreadsheet Imports
No matter how advanced the analytics field gets, there will always be those who simply want to do their analysis in spreadsheets. Many analytics products provide ways that data can be downloaded or exported to spreadsheets so analysts can manipulate the data there as needed. Spreadsheets, especially Microsoft Excel, tend to be the lowest common denominator for analysts. However, one of the downsides of using spreadsheets is that they are more difficult to share, collaborate on and can have version control issues.
SQL/R/Python
Those who fancy themselves “data scientists” often prefer to analyze data via SQL or via reporting languages like R or Python. These programming interfaces and languages provide a lot of flexibility and can be used to do custom and advanced analysis. While more data consumers are learning these languages these days, they are still difficult to scale, especially at large enterprises.
Impacts of Reporting Interfaces
So with all of the choices available for doing analysis, how should organizations choose the right one for them? As usual, there is no one right answer, but the following will provide some things for you to consider when making a choice. Also, it is important to keep in mind that many organizations will need to use more than one for different internal audiences.
Data Consumer Types
Most organizations have different types of data consumers. There is often a core analytics team that does analysis daily and there are others who are more casual data users. Casual data users might include executives or those within the business who occasionally need to see data to inform their decisions. An example of the latter might be a product owner who wants to see weekly or monthly website views of products they manage.
The reporting needs of the core analytics team will be much more advanced than that of casual users. The core analytics team will likely want to do multiple data breakdowns and filter data by multiple dimensions/properties. For them, having a freeform reporting interface or using a programming language might be the best fit. But these advanced reporting interfaces can often be intimidating or overwhelming for folks that only occasionally conduct analysis. Executives may only want to see high-level dashboards from a BI tool.
It is important to understand the skill level of each internal data consumer and ensure that each is provided a reporting interface that is conducive to their needs and aptitude. I have seen many organizations fail by attempting to use a “one size fits all” approach and forcing all data consumers to use the same analytics reporting interface. In these situations, it is common for the core analytics team, which skews more advanced, to assume that all data consumers can master reporting interfaces that are either too complex or too confusing for casual data consumers. Even when more advanced reporting interfaces are curated for more novice data consumers, the latter find it difficult to drill into the data and find the answers they need without requiring assistance. I myself have attempted to train casual data consumers on advanced reporting interfaces only to see them struggle to learn them. In these cases, I have found it more helpful to provide multiple analytics reporting interfaces tailored to the data consumer audience.
Analytics Delivery Models
In the analytics world, there are several models available for conducting analysis. Some organizations use a centralized model in which data consumers submit requests for analysis and the analysis is done by a centralized team. Other organizations attempt to use a decentralized approach in which everyone is expected to conduct their own analysis (often called data democratization). There are also hybrid approaches that leverage the centralized model for some types of analysis and a decentralized approach for others (you can hear a talk on this topic here). There are pros and cons of each approach and this is another situation where different approaches will be better or worse for different organizations.
But one thing I have seen is that mistakes made in the reporting model can negatively impact the analytics delivery model. For example, let’s imagine that Acme Corp, as an organization, chooses to use a decentralized model for analysis. But at the same time, they decide to standardize on the freeform analytics reporting interface. Over time, they find that many casual data consumers struggle to understand the data in their implementation and how to report on it. Slowly, the core analytics team begins getting emails and requests for help. At first they can keep up and attempt to do additional training, but soon they realize that the data consumers are not able to self-serve and the number of requests becomes overwhelming. In this situation, one I have seen many times, there was clearly a mismatch between the reporting interface and the data consumers and this mismatch broke the overall analytics delivery model. This is why I believe that there is a direct and important relationship between the analytics reporting interface and the analytics delivery model.
Finding the Sweet Spot
In my twenty years of helping organizations with analytics, I have rarely found that one interface will work for all data consumer types and all analytics delivery models. I have seen limited success with analytics product training for casual data consumers, since if you aren’t in a tool very often, it is difficult to learn. I think the best organizations take the time to understand their corporate culture, the skills of the different types of data consumers and use both to choose their analytics reporting interface and analytics delivery model. I have done many workshops and trainings with organizations to help them uncover which interfaces and models will work best for them. I also encourage organizations to periodically try new reporting interfaces for different data consumer types to see if one “clicks” with them more than the one they are currently using. At Amplitude, we have attempted to make a reporting interface that is easy for casual data consumers and we are proud of the fact that at some organizations hundreds of people self-serve on a daily basis. For those that want a more flexible interface, we provide that in Data Tables. This is why we have created easy ways for analytics teams to leverage work done in other analytics vendors (Google and Adobe) to send data to Amplitude so they see if our reporting interface can compliment what the core analytics team uses.
At the end of the day, all organizations want to effectively use data and decrease how long it takes them to turn data into insight. Choosing the right analytics reporting interface for your different data consumers is a great step in improving the overall value of the analytics program.


Adam Greco
Former Product Evangelist, Amplitude
Adam Greco is one of the leading voices in the digital analytics industry. Over the past 20 years, Adam has advised hundreds of organizations on analytics best practices and has authored over 300 blogs and one book related to analytics. Adam is a frequent speaker at analytics conferences and has served on the board of the Digital Analytics Association.
More from Adam


