What 27,000 AI Sessions Taught Us About How People Use Agents
We analyzed one week’s worth of Amplitude Global Agent sessions with our agent analytics tool. Here’s what we found.

This blog was co-authored by Sandhya Hegde, Cofounder at Calibre - an applied AI research firm
If you have shipped an AI product recently, you probably struggle to answer many of these questions: How many of your users like the agent’s output? How many sessions succeed only because the user corrected the agent mid-stream? What do your users try to do with the agent that you never really designed for?
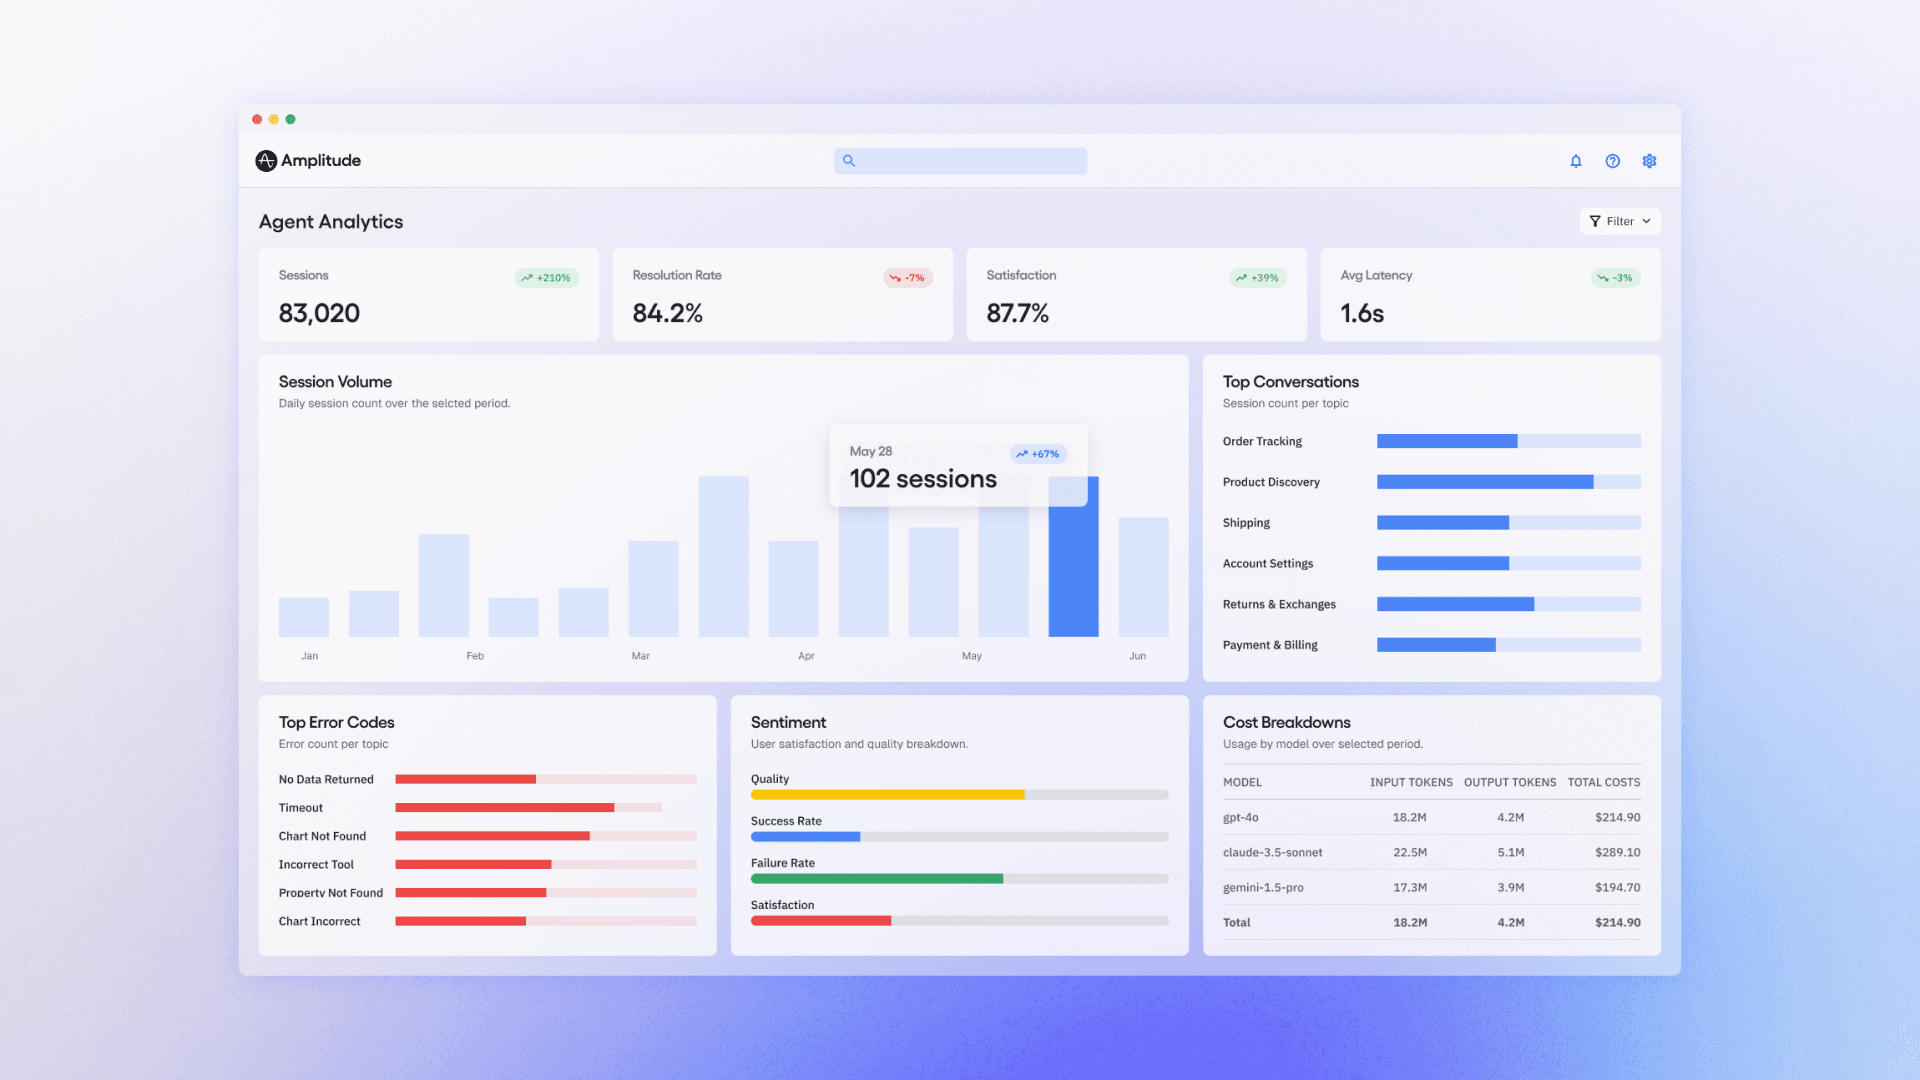
We couldn't answer them either. So we’ve been working on an agent analytics tool for our newly launched Amplitude Global Agent.
Our most recent dataset: 27,410 sessions from one week of Global Agent usage. Every real conversation across thousands of organizations and users. We scored each session with 19 automated LLM-as-judge evaluators (rubric scorers, classifiers, and detectors), covering everything from task completion to user friction to intent classification.
We found some surprises that might prove instructive to anyone building complex agents:
- Nearly a third of sessions succeed only because the user corrected the agent, making graceful recovery a critical design strategy for agents
- Most sessions don’t have any thumbs up/down feedback despite what happened in them. Both user satisfaction and dissatisfaction are largely silent.
- Nearly a third of sessions were not even analytics questions. Support and strategy were far more frequent than we first anticipated.
- Agents are a great way to reduce social friction in collaboration. Our users often want to follow their teammates’ work via agents.
The importance of graceful recovery
93% of sessions succeeded while 7% didn’t. On its face, that sounds like a great result, but we wanted to dig deeper to learn more from our data. So we classified every session into a narrative arc:
|
Arc |
Freq. |
What it looks like |
|
Smooth Delivery |
42% |
It just works |
|
Graceful Recovery |
32% |
Hits a wall, user redirects, still succeeds |
|
Slow Grind |
19% |
Agent gets there eventually, but it takes work |
|
Dead End |
7% |
Complete failure |
42% of sessions are the “it just works” experience. Users prompted the agent, it responded in an anticipated way, and the information it gave was accepted. That sounds good until you realize that 58% didn’t “just work.”
Graceful Recovery came in at 32%: nearly one in three sessions succeeded only because the user corrected the agent. If those users hadn't pushed back, those sessions would have failed.
In one session from our data, a user building percentage-based failure dashboards watched the agent get stuck mid-fix. They wrote: “It seems like you got stuck, can you try again?” That was enough to unblock the agent.
In another session, an agent built charts with user property filters placed incorrectly (at the event level instead of the segment level), causing errors across a 12-chart dashboard. Then it self-diagnosed the root cause and rebuilt every chart with the filter correctly placed. The session scored high quality, not despite the errors, but because of the recovery.
This pattern held at the extremes: nine of the ten highest-quality sessions in our dataset had multiple errors along the way. One had ten.
Quality comes from recovering, not from avoiding mistakes. This 32% share validates the need for human-in-the-loop experience in analytics today. Graceful Recovery sessions end almost as well as smooth ones: task completion of 2.67 vs. 2.75, with a failure rate of just 10%.
Dead End sessions, on the other hand, fail the majority of the time. But interestingly, Dead End friction is lower than Graceful Recovery friction. Users who hit a dead end don’t fight or complain, they just leave. The median Dead End session lasts under a minute.
Low friction isn’t always a sign of success. Sometimes, it’s the signature of a user who has already given up.
The sounds of silent feedback
We built an evaluator specifically to measure user satisfaction. It scores each session -1 (rage-quit), 0 (neutral), or +1 (delight) based on what the user actually said. We set the bar high deliberately: a polite "thanks" after a mediocre response scores 0; only genuine enthusiasm counts as +1.
The result: 97.7% of sessions scored 0. This tells us not that most users were dissatisfied, but that they overwhelmingly didn't say anything at all. Only 2.2% expressed genuine delight. Only 0.1% explicitly gave up.
We do have reason to think that silence tends to point toward satisfaction, though. When we sampled sessions with the lowest satisfaction scores, the language was visceral and universal.
- One user literally told the agent to “go away.”
- Another just said, “I’ll do it myself.”
These rage-quits are rare, but they’re telling: explicit feedback, positive or negative, is the exception, not the norm. The absence of complaint is the closest thing most sessions have to a positive signal.
Sessions where the user is slightly dissatisfied are invisible to every quality metric based on conversation text alone.
This is where behavioral signals become essential. An LLM-as-judge evaluator can only read the transcript. It has no idea whether the user copied the agent’s response, regenerated it, edited their prompt in frustration, or silently closed the tab. But those actions are the real satisfaction signals.
Did the user copy the output into a Slack message? That’s delight. Did they hit regenerate? That’s dissatisfaction. Did they abandon after turn 3? That’s a dead-end sentiment analysis that just a transcript might not reveal.
Not just analytics
Amplitude’s Global Agent was designed to be an analytics agent. Naturally, we assumed people would use it for analytics: creating charts to answer questions about user behavior.
Nearly three in ten sessions go beyond pure data querying:
- about 13% are support questions
- 8% are user lookups
- 7% are taxonomy and governance questions
- a small fraction are export tasks or strategic modeling
The taxonomy sessions were especially revealing. A user asked about an event called start_session, and the agent said it didn’t exist. The user had to correct the agent: the event was there, just under a slightly different name. These are taxonomy problems, not analytics problems, yet users expect the agent to solve them.
Roughly one in seven sessions push the agent beyond its designed capabilities entirely, and the top boundary isn’t analytics.
A small but fascinating subset of sessions push the agent into territory that looks more like a strategy consultant or a BI tool. One product strategist asked the agent to understand upsell readiness for single-product accounts. Over dozens of turns, the agent segmented accounts by tier, found thousands of users per month clicking a cross-sell entry point (an organic demand signal), and discovered zero conversions on the next step, revealing a broken upsell funnel.
In another session: “If the current daily token consumption trend continues, what will the Global Agent’s total LLM cost be for Q2 2026?” In another: “RICE-score every item, pick a natural promotion threshold, and call set_execution_plan.” In another: “Which improvement points would you suggest to run as experiments to improve the funnel?”
These queries are competitive intelligence, revenue modeling, and experiment design. The agent often can’t deliver, but the intent reveals what users actually want from AI agents. It’s far more ambitious than we’ve been designed for so far.
The agent as a social layer
One pattern we didn’t really anticipate: users treating the agent as a way to access work from the rest of their org. Asking about a teammate's metric by name, asking the agent to analyze their colleague’s usage of the tool, etc.
An admin asked about a colleague’s access rights, then told the agent to change it. (And the agent actually executed the role change.)
One user dropped a bare UUID into the chat, no context, no explanation, and expected the agent to resolve it to a person. It did. Multiple users asked for dashboards owned by specific teammates.
Three patterns emerged:
- “Show me someone else’s work” (dashboards, charts, metrics belonging to colleagues)
- “Look up this person” (resolving IDs to names, investigating activity)
- ”Who’s using this?“ (meta-usage questions about tool adoption)
Global Agent was originally designed for data questions. Users are also using it as a social layer, a way to navigate the organization’s shared analytical work. And sometimes, as a way to act on that work: changing permissions, investigating colleagues, auditing shared artifacts.
Most of these sessions don’t go well because the agent isn’t optimized for these kinds of actions yet, but the demand signal is loud. People want to understand not just their data, but what their teammates are doing with it.
Even our evals need evals
No single metric captures agent quality. When we cross-tabulated task completion against user satisfaction, 70% of sessions scored full marks on completion and zero on satisfaction. The user got what they asked for and said nothing.
You need the full constellation: completion, quality, friction, confusion, arc, and behavioral signals, because each captures a dimension the others miss.
And the evals themselves are imperfect. LLM-as-judge is good enough to surface patterns at scale (ambiguous requests really do fail 4x more than simple ones, Dead Ends really are dominated by invisible errors), but it’s not ground truth.
We’re actively calibrating with human validation and tightening the feedback loop.
What we’d tell teams building agents
Invest in graceful recovery. Nearly 1 in 3 sessions succeed because the user corrects the agent mid-stream. Build UX that makes correction easy: show your work, explain your reasoning, and make it obvious when something went wrong. The highest-quality sessions in our dataset weren’t the error-free ones, but the ones that recovered.
Make failures visible. Tool failures are recoverable because the user sees them break. Wrong answers are fatal because they look right. When in doubt, have your agent surface uncertainty. A broken chart that and an agent that says “I couldn't build this” is safer than a working chart built on the wrong event.
Expect the unexpected. Nearly a third of sessions aren’t even analytics queries. Users will treat your agent as a support tool, a strategy consultant, and a social layer for navigating their colleagues’ work. Design for these adjacent use cases, or at least fail gracefully when they show up.
Instrument the agent, not just the product around it. Traditional analytics tells you what happened before and after the agent conversation. It can’t tell you what happened inside it. You need evaluation signals (task completion, error domain, friction, confusion) attached to the session itself, queryable alongside your product events. The teams that figure this out first, feeding their coding agents the right bugs, their support agents the right context, their product agents the right behavioral signals, will build products that get better autonomously.
If you're working on an agent, we'd love to get your feedback on Agent Analytics. Sign up here to join our Partner Design Program for early access.
Methodology: This analysis covers 27,410 sessions from Amplitude's Global Agent, evaluated between March 30 and April 7, 2026, across thousands of organizations. Evaluations were performed using an automated LLM-as-judge pipeline with 19 evaluators (rubrics, classifiers, and detectors). Relative patterns are directionally robust; absolute rates are subject to ongoing calibration.

Vinay Goel
Staff AI Engineer, Amplitude
Vinay is a Staff AI Engineer at Amplitude. He builds the foundational AI platforms that empower internal innovation and help define the future of AI-driven analytics at scale.
More from VinayRecommended Reading

How Cisco Systems Accelerated Adoption by 20% Through Data Innovation
Apr 15, 2026
5 min read

Creating the Intelligence Layer: Welcoming CPO Gab Menachem
Apr 14, 2026
6 min read

How We Built Agents That Understand The Language of Product Analytics
Apr 13, 2026
20 min read

AI-Driven Marketers Have a Focus Problem
Apr 10, 2026
8 min read