The Eval Signal That Predicts 3x Agent Retention
We used Agent Analytics to understand whether eval signals actually predict whether users come back. The result surprised us.

This blog was co-authored by Sandhya Hegde, Cofounder at Calibre, an applied AI research firm.
If you’ve shipped an agentic feature to your product in the last year, you’ve probably asked some version of this: Are agents making my product stickier, or just cannibalizing the parts that already work? Do users with high eval scores actually retain better? How do I understand the impact of agent improvements at the user and business level, not just inside a session?
We had those questions too, so we ran an analysis on Amplitude’s Global Agent for 20K+ users who were regular Amplitude veterans (effectively power users) before we launched Global Agent. We wanted to understand how positive agent sessions (based on eval scores) affected their relationship with Amplitude and find predictors of better long-term retention.
The core insight: Scoring vs retention
For established users of an AI product, eval scores and retention are basically orthogonal. Bad sessions don’t push them out. Good sessions don’t keep them in.
For new users of an AI product, that relationship is the opposite: Eval scores are highly predictive of adoption and future retention. The single sharpest value signal is whether the user had a positive experience and saved the agent’s output in the first session. Below are the three patterns that stood out in our data:
1. Our most retained users are also having the most negative agent experiences.
Pure correlation, not causation. Our power users push the agent harder than anyone else, hit dead ends constantly, and come back the next day with new queries anyway. They’re not retained because the agent fails them. They’re retained despite it because the agent is part of how they work, and friction is the cost of living on the jagged frontier.
2. A positive first-week experience was worth a 3x retention multiplier.
This was the sharpest signal. Users whose first week/session with Global Agent was strictly positive retained 3x better over long periods of time than users whose first week tripped a single failure flag, even when both groups were equally active everywhere else in Amplitude. Same product, same user quality, different first impression, and completely different downstream behavior.
3. Early positive agent experiences pulled overall Amplitude usage up too.
The agent isn’t a sandbox (though it technically runs in one). A great first session with Global Agent improved weekly retention to the rest of Amplitude’s platform, not just to the agent itself. Bad first sessions, on the other hand, didn’t push users off Amplitude. They just pushed them away from the agent specifically.
The implication: If your eval-cohort is showing strong retention and you’re feeling smug that low eval scores aren’t hurting retention, don’t. They probably are. You’re just not looking at the full picture.
The first clue: Tangled eval cohort retention curves
When we set out to correlate eval scores and retention, we started simple. We plotted weekly retention by eval cohort across all users based on session modes (refer to our agent analytics modes post for definitions of Clean Success, Graceful Recovery, Silent Fail, and Dead End). To our surprise, we got nothing. All four eval cohorts were within 5% of each other.
Chart 1: Established users in any eval cohort retain at roughly the same rate.
At first glance, there are two ways we can interpret this:
- Bad sessions are a great demand signal. Users kept trying because they really needed an answer (not because they were masochists... or maybe they are).
- The eval categorization and scoring don’t matter. It’s either incorrect or irrelevant.
It seemed dangerous to embrace either. They would easily become great excuses to not care about the quality of our agent’s output in each and every session.
So we went back to the drawing board of user psychology. What makes users love/hate an AI product? Change their old workflows and become sticky with a new surface? Give it a chance to work? Was it the agent’s sheer power to be able to handle complex tasks or the speed with which it automated simple ones?
We wanted to find the strongest signal that made a difference.
The data immediately revealed a story when we split the question into two cohorts (established users and new users of an AI product) and asked each question separately. The tangled chart becomes clear, and the answers are nearly opposite.
The signal: First-time UX eval score predicts long-term retention
At this point, we started focusing on first-time Global Agent users only. Note: These were all already power users of Amplitude.
We took Q1 2026 first-time Global Agent users and split them by first-session outcome:
- positive (clean success flags) vs.
- negative (any failure flag tripped, including thumbs-down feedback)
The retention curves separate immediately and stay separated week over week.
Chart 2: For first-time users, first-session eval outcome predicts retention
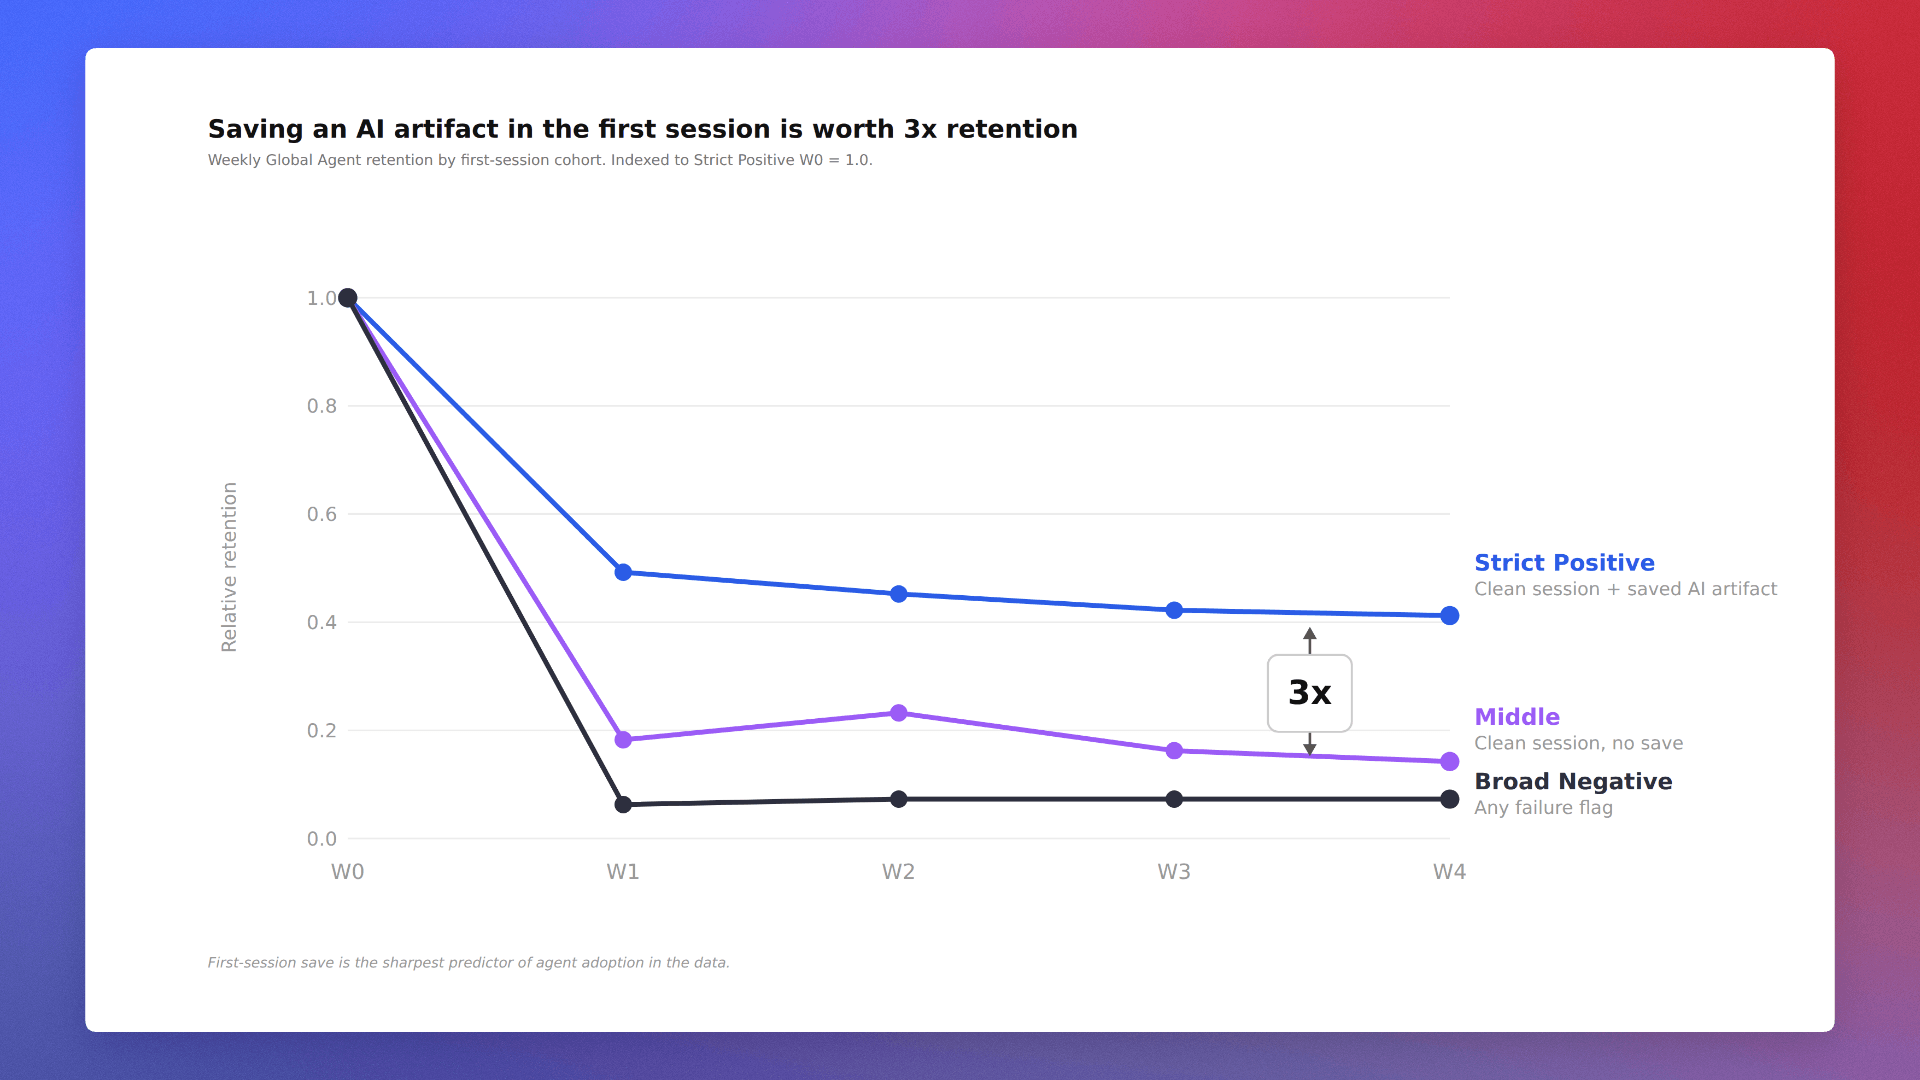
We then layered in the strictest “user got real value” signal in the data: whether they saved the agent’s output (a chart, cohort, dashboard, etc.) and committed it to their workspace.
Chart 3: Users who saved an AI artifact in their first (positive) session retain at 3x the rate of users whose first session hit any failure flag.
That’s a 3.57x gradient at Week 1, holding at 3x by Week 4. Monotonic, persistent, and specific to Global Agent.
If you’re working on an agentic product, measure first-session eval scores and value extraction. Tie it to user engagement and retention so you can show the value of new AI features to your overall business.
To do this, your eval data and your product analytics need to share a schema.
Most teams can’t run this analysis. Their eval data lives in one warehouse, their product analytics live in another, and any cross-cutting question requires a JOIN, a schema reconciliation, and many meetings.
Amplitude’s agent analytics fires both into the same event stream:
- Eval scores. Structured session-evaluation events recorded automatically for every Global Chat session, with boolean flags for things like Has Task Failure, Has Negative Feedback, Has Technical Failure.
- Product analytics. Cross-product event taxonomy. When a user saves a chart, builds a cohort, or modifies a dashboard, those product actions fire into the same stream as the agent’s session events, with consistent property naming.
That means cohort definitions like “users who had a clean agent session AND saved an artifact AND came back to send a message in week 2” are direct boolean conditions on a single user’s history. No JOIN. No schema reconciliation. One query.
What this means for your agents
The first session is the whole adoption decision. New users meeting your agent are making a binary call: Is this useful enough to come back to? Value moments like save decisions happen within an hour of the first session, and what happens in that hour determines the next four weeks.
Eval and analytics need to share a schema. None of this analysis would have been possible without session-level eval flags fired into the same event stream as product actions, with consistent property naming. Cross-cutting queries like “users with a clean session AND a save AND a return message in week 2” only work if all three events live in the same place, scoped to the same user.
If you're working on an agent, we'd love to get your feedback on Agent Analytics. Sign up here to join our Partner Design Program for early access.
Below is our complete methodology for running correlation analysis between session-level eval scores and long-term product usage metrics.
Defining events, eval flags, and cohorts.
Three event categories, all in the same event stream:
1. Session-level eval events with structured outcome flags. Fire [Agent] Session Evaluation once per session with properties for flags like Has Task Failure, Has Negative Feedback, Has Technical Failure, Agent ID, Turn Count, Session Cost USD, and Request Complexity. Flags must be booleans (or string-enums you can filter on), not free-text descriptions. If your eval pipeline produces narrative summaries, derive boolean flags from them and fire those alongside.
2. Per-message agent telemetry. [Agent] User Message for user messages, [Agent] Score (source=”user”) for thumbs up/down feedback. These are your retention measurement targets and your fine-grained feedback signals. Each event should carry an Agent ID property so you can scope analyses to one agent at a time.
3. Product action events with attribution back to the agent. When the agent “saves” or commits work on the user’s behalf, the resulting product event should be logged with a property attributing the action to the authoring agent. These are your value signals.
Cohort definition: Strict Positive: clean win + extracted value.
- ≥1 session in W with all failure flags = false
- 0 sessions in W with Has Negative Feedback = true
- 0 sessions in W with Has Task Failure = true
- ≥1 product save event (or equivalent value action) with source = <your agent attribution>
Cohort definition: Broad Negative: every session had something wrong.
- ≥1 session in W
- 0 sessions in W with all failure flags = false
Cohort definition: Middle: clean experience, no value extracted.
- ≥1 session in W with all failure flags = false
- 0 product save events with source = <your agent attribution>
With this taxonomy in one event stream, the analyses above are direct boolean queries on a single user’s history. No JOINs, no schema reconciliation between data models.

Vinay Goel
Staff AI Engineer, Amplitude
Vinay is a Staff AI Engineer at Amplitude. He builds the foundational AI platforms that empower internal innovation and help define the future of AI-driven analytics at scale.
More from VinayRecommended Reading

Wanted Lab Grows Sign-Ups by 150% & Builds Experimentation Culture
Jun 17, 2026
6 min read

How to Balance Inference Cost and User Experience for Agents
Jun 17, 2026
10 min read

Introducing Zoning Insights: Web Intelligence at a Glance
Jun 11, 2026
8 min read

Five best practices for getting started with AI agents
Jun 11, 2026
7 min read